Monday, July 31, 2006

Right here in Lubbock, at Texas Tech University's Rawls golf course, located about a mile and a half from my office, a 53-year-old gentleman named Danny Leake shot a hole-in-one at the same hole (the sixth) this past Saturday and Sunday. According to the article in the Lubbock Avalanche Journal (registration required), the hole had distances of 174 and 178 yards the two days, differing as a result of pin placement on the green.

I was very pleased to see the A-J article probe the statistical aspects of Mr. Leake's accomplishment, drawing from a set of probability estimates of various hole-in-one phenomena made years earlier by mathematician Francis Scheid for Golf Digest. Scheid's estimates are also shown here, in the yellow-shaded sidebar to a 2005 Golf Digest article (toward the bottom of the page that comes up).

What Leake exhibited is nothing, if not a hot hand, so I had to pursue the topic further. The neatest thing I found was an amazing USA Today page on holes-in-one, which includes links to a compilation of all aces on the PGA tour from 1990 to mid-2006, and to a similar compilation for the LPGA tour (beginning in 1992).

The sidebar accompanying the aforementioned 2005 Golf Digest article stated, among other things, that the odds of an "[a]verage player acing [a] 150-yard hole" were 80,000 to 1, and for a 200-yard hole, 150,000 to 1. Technically, odds are not the same thing as probabilities, but for extremely rare occurrences, the terms converge.

As noted above, the hole that Leake aced twice had a distance of roughly 175 yards from the tee, halfway between the two figures cited in the previous paragraph. Let's use the odds for a 150-yard hole (80,000 to 1). At this point, I'd like to introduce a new twist; some may disagree with this way of addressing the question, but it seems reasonable to me. Even though there are 18 holes in a round of golf, holes-in-one seem to come exclusively (or almost exclusively) on par-3 holes. Texas Tech's Rawls course had four such holes, numbers 3, 6, 10, and 16. In two days, a golfer would thus get to play par-3 holes eight times total.

We can then ask, given a prior probability of 1-in-80,000 (.0000125) of a hole-in-one from a single attempt off the tee, what is the probability of someone acing two (or more) holes in eight opportunities? An online binomial calculator tells us that such probability is .000000004 or 1-in-250 million.

That, however, would be for making a hole-in-one on any two holes out of eight (i.e., the two aces could come from among the four par-3 holes on one day, or from one hole each on the two days and, if the latter, they could be on same hole or different holes).

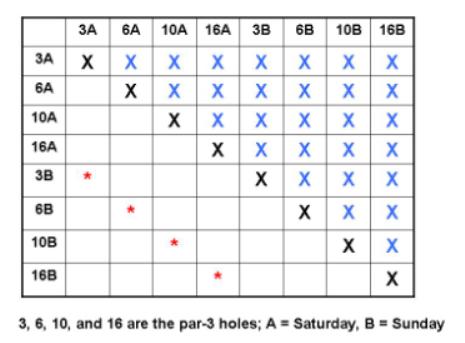
We have to restrict the situation to scoring the aces on the same hole both days. I've created a chart (below) to illustrate that there are 28 possible ways to ace two holes out of eight, some on the same day, others on different days. The main diagonal is removed (signified by black X's) because, for example, a golfer could not ace Hole No. 3 twice the same day. The 28 blue X's above the diagonal indicate redundancy with the 28 cells below the diagonal. The cells with no X's thus represent the 28 possible ways to ace two holes out of eight. Finally, there are only four cells (indicated by red asterisks) where the golfer would be acing the same hole on back-to-back days. So, among the 28 ways to get two holes-in-one out of eight holes generally, only four ways fit with what happened in Lubbock, and of course 4/28 = 1/7.


We thus multiply our prior value of 1-in-250 million by 1/7, yielding 1 in 1.75 billion. That's my best guess!

Sunday, July 30, 2006

Just a few quick items in connection with today's Major League Baseball action...

When I saw the Houston Astros were pinch-hitting for Brad Ausmus late in this afternoon's game against Arizona, it reminded me of a write-up I was planning to do.

A little while back, a discussant known as "TechTown" on the RaiderPower.com Texas Tech sports chat site pointed out that Ausmus had gone through a 0-for-40 hitting drought in late June and early July. Hence, it was no surprise to me when Ausmus was lifted today.

Looking at Ausmus's statistics, for the last couple of years and for his career, he's roughly a .250 hitter. That means that on any given official at-bat, he has about a .75 probability of making an out. Raising .75 to the 40th power (for the length of the slump) yields .00001 as the probability of Ausmus's drought, assuming independence of at-bats (i.e., that the outcome of any one at-bat has no effect on the next at-bat, like coin-flipping).

In other news, the Cubs recorded their first home four-game sweep of the Cardinals since 1972, and the Mets swept the Braves in Atlanta for the first time since 1985.

Saturday, July 29, 2006

I typically don't write much about tennis. However, I've just been watching taped coverage on cable television's Tennis Channel of the Dominik Hrbaty-Robby Ginepri quarter-final match in the Countrywide Classic from UCLA's L.A. Tennis Center (UCLA being my undergraduate college alma mater).

I came across the match midway through, and when I heard the announcers saying that Hrbaty had won several straight points, my ears naturally perked up. Being the streak fanatic that I am, I kept rooting for Hrbaty to win more points (or conversely for Ginepri to lose more points) and it kept happening. By the time Hrbaty's run ended, he had won 18 straight points!

This summary on the men's ATP tour website says that Hrbaty won 19 straight points. But even by its own enumeration of the sequence, the article confirms it was actually 18 points:

After a tight start to the match Domink Hrbaty blew open his quarterfinal with Robby Ginepri, winning 19 straight points at one stage en route to a 7-6(0), 6-2 win.

Hrbaty won 19 straight points starting with the last point of the 12th game of the opening set. He then won the tie-break to love, held serve to love to open the second set, then broke Ginepri to love in the second game. He won the first two points of the third game before conceding the first point to Ginepri with a double fault. Ginepri won just 19 second set points.


Last point of the 12th game of 1st set = 1
Tie-breaker 7-0 = 7 (8 cumulatively)
2nd set, 1st game at love = 4 (12 cumulatively)
...........2nd game at love = 4 (16 cumulatively)
...........3rd game, first 2 points = 2 (18 cumulatively)

Inquiry into streakiness -- and other statistical phenomena -- in tennis is not limited to anecdotes, however.

Economist Franc Klaassen of the Universiteit van Amsterdam, in collaboration with Jan Magnus, has published a number of articles on tennis (click here for a list of Klaasen's publications, containing links to the articles themselves). Of particular interest to aficionados of streakiness is the following article:

Klaassen, F.J.G.M. and J.R. Magnus (2001), “Are Points in Tennis Independent and Identically Distributed? Evidence from a Dynamic Binary Panel Data Model,” Journal of the American Statistical Association, 96, 500-509.

By "independent," researchers mean that the outcome of one point has no bearing on the outcome of the next, just like coin-flipping. The opposite would be "dependence," as in streakiness or momentum, where winning one point would increase one's probability of winning the next point.

The aforementioned article studied singles play at Wimbledon. Putting aside the intense statistical aspects, Klaasen and Magnus reached the following conclusion:

The independence hypothesis... is rejected with a p-value of 1.7% (men) and 0.3%(women)... Winning the previous point has a positive effect on winning the current point, both for men and for women,...

(Readers with statistical training will know that for a result to attain "statistical significance," it must have a probability of 5% or less [p < .05] of occurring purely by chance.)

Tennis, in fact, is one of the few sports in which streakiness (or momentum) appears to be fairly well documented, in not just the Klaasen and Magnus study, but also in earlier research by Jackson and Mosurski. Studies of tasks such as basketball shooting and baseball hitting generally have not been able to reject independence (in the various links sections on the right-hand side of this page, see the pages of S.C. Albright, Tom Gilovich, and Jay Koehler, as well as the link to a hot hand bibliography further down, for details).

Wednesday, July 19, 2006

About two months ago, while attending a conference on networks at Indiana University Bloomington (see photos on another of my blogs), I visited with psychology professor Steven "Jim" Sherman, whom I have known for over 20 years. I first met Jim in the spring of 1984, while visiting IUB on a trip to look at potential places to go to graduate school (I ultimately chose the University of Michigan).

I would occasionally see Jim at conferences over the years, and then out of the blue, I got a call from him some time in the fall of 2002. Jim invited me to a small, informal conference he was co-organizing on statistics and sports decision-making to be held in March 2003 in Scottsdale, Arizona (to enable conference attendees to attend spring training if they wanted!). A photo of the participants in that gathering is shown below.


Jim is shown front and center in the shorts, flanked to his right by University of Chicago professor Richard Thaler, the other co-organizer. Right behind Jim is Cornell's Tom Gilovich, who was the lead author on the 1985 article that introduced hot hand research. Right behind Tom (skipping the gap in the third row), is me, at the center of the back row. To my right is legendary baseball analyst Bill James, and in front of Bill, to his right, is fellow baseball expert Rob Neyer.

Anyway, back to my visit with Jim in May 2006. As I was entering his office for our meeting, I noticed he had a letter Scotch-taped to his door. The letter, dating back more than 20 years, was from former Indiana men's basketball coach Bob Knight, now, of course, the coach where I'm located, Texas Tech University. And the letter pertained to, of all things, the hot hand. As it turns out, Jim had sent Coach Knight a copy of the aforementioned mid-1980s article by Gilovich and colleagues, and Knight had sent this reply...


The letter has been on Sherman's door for over 20 years, for all passersby to see. Given the letter's status as an historic artifact (sometimes spelled artefact) in the annals of hot hand research, I asked Jim if we could make a copy of it for posting on my website, and he agreed. (I figured that most people probably wouldn't want their signature broadcast to the world, so I blocked out Coach Knight's.)

Coach Knight's skepticism of hot hand research -- the general finding of which is that making one or more shots in a row does not tend to raise a shooter's likelihood of making the next shot -- has been reported previously, in this Wikipedia entry on the "Clustering Illusion" (of which I am not the author). Still, I thought it would be neat to display a copy of the original letter. By the way, Boston Celtic coaching great Red Auerbach has also expressed skepticism.

Knight is absolutely right about the multitude of factors that determine whether a basketball shot will go in or not. Many researchers have voiced similar concerns, such as the possibility that the inability to detect streakiness could stem from players who just made a shot being guarded more closely the next time, or feeling more confident and shooting from farther away. In an attempt to eliminate as many extraneous factors as possible, researchers have used controlled shooting exercises, such as the NBA three-point shooting contest the night before the All-Star Game. Still, little evidence of streakiness has been observed (see the Koehler & Conley [2003] paper at the following site).

Monday, July 17, 2006

Chipper Jones of the Atlanta Braves saw his streak of 14 straight games with an extra-base hit end tonight. He had tied the previous major-league record.

Thursday, July 06, 2006


I recently returned from Seattle, where I attended the Society for American Baseball Research (SABR) conference and presented a research poster entitled "Top Major League Baseball Streaks of 2005."

To the right is the city's famous Space Needle, of which I snapped a picture. The Space Needle is part of the larger Seattle Center complex.

Below, I'm standing in front of my poster, clad in a mid-late 1970s, Bill Veeck-inspired Chicago White Sox jersey. Baseball garb is a common form of attire at SABR meetings.


In my poster, I displayed brief synopses of several occurrrences from 2005 that stood out to me, either in terms of estimated statistical rarity or historical significance (i.e., time since previous similar occurrence). Here are the streaks...

Philadelphia’s Jimmy Rollins ended the 2005 season on a 36-game hitting streak, tying him (at the time) for 10th on the all-time list. According to the July 14-19, 2005 USA Today Sports Weekly (providing statistics through roughly the first half of the season), Rollins was batting .273, which converts to a baseline probability of roughly .710 of his getting at least one hit in a game (because a player usually gets multiple at bats in a game, the probability of his getting at least one hit is generally pretty high). This latter probability is raised to the 36th power (length of the streak), yielding as the probability of the streak, .710^36 = .000004.

In August 2005, the Florida Marlins went 25 straight games with no one other than Miguel Cabrera or Carlos Delgado homering (game-by-game log for second half of 2005 season). Using June and July games as a baseline (where at least one Marlin other than the “big two” had homered in 19 of 53 games, .358, or a failure rate of .642), the probability of the drought was .642^25 = .00002.

Poor performance from the Kansas City Royals is not unexpected. Still, when a team loses 19 straight games (as the Royals did in 2005 from late July well into August), it’s noteworthy (game-by-game log). Before the streak, KC had a 38-63 record, for a winning percentage of .376; conversely, this is a .624 losing percentage, which when raised to the 19th power = .0001. (Steve Levitt also looked at the Royals' losing streak last year.)

Seattle’s Ichiro Suzuki, who in 2004 set the single-season record for most hits, suffered through a 0-for-22 slump (longest of his career) in early August 2005. The mid-season Sports Weekly listed him as batting .311 (a failure rate of .689), so the probability of Ichiro’s going hitless in 22 straight official at-bats is .689^22 = .0003.

From mid-July 2005 on, the Red Sox won 19 of 20 at home (log). Boston’s home winning percentage prior to this stretch was .581. Using a binomial-statistic calculator, the team’s probability of winning 19 (or more) out of 20 was roughly .001. (This calculation probably overstates rarity of this hot stretch, as opponents included Tampa Bay, Minnesota, Kansas City, and Texas, plus Chicago White Sox.)

Finally, the 2005 White Sox recorded many impressive streaks:

They won 16 of their last 17 games (5 regular season, 11-1 in post-season). Based on their .611 winning percentage through the end of August, the probability of their winning 16 (or more) games out of 17 was approximately .005. (Cleveland made a late-season run rivaling that of the 1969 New York Mets, but it wasn’t enough to catch the Sox.)

Chicago pitchers recorded four straight ALCS complete games vs. the Angels, a similar post-season achievement not having occurred since Yankee pitchers threw five straight complete games in the 1956 World Series.

Chicago pitchers again worked their magic, not allowing the Astros a hit in their final 29 World Series at bats with runners on base, unprecedented in World Series play since the 1966 Dodgers (31 at bats).

I also mentioned some streaky developments from thus far in 2006 on my poster. Two of them I've already blogged about here (shown below), the University of South Carolina's five straight homers in NCAA play-off action against Georgia (June 12, 2006 entry) and Vladimir Guerrero's hitting against the Texas Rangers (June 5, 2006 entry).

Two additional 2006 streaks I noted on my SABR poster were the Yankees' streak of 10+ hit games and Boston catcher Jason Varitek's homering every May 20 for five straight years (2001-2005), a run that ended in 2006 (thanks to Indiana University professor Jim Sherman for bringing the latter streak to my attention).

Below are some additional photos I took of the SABR poster session (here's the official list of posters, including summaries).