This past Monday night, as described a few entries down from here, the Miami Heat unleashed a 27-0 spurt on the New York Knicks, en route to a 101-83 victory in south Florida.
Tonight, the teams went up to the Big Apple for a rematch. Not only did the Knicks avenge the earlier loss, beating the Heat 116-96; the hosts used a streaky performance of their own in doing so.
Specifically, New York's Jamal Crawford (a former Michigan Wolverine) made 16 straight field-goal attempts (three short of the team record, but highly impressive, nonetheless), went 8-of-10 on three-point attempts for the night overall, and ended up with 52 points (article). As I've excerpted from the play-by-play sheet, Crawford's 16-field goal sequence was as follows (broken up into sets of four for ease of viewing, with three-pointers highlighted in red):
Jamal Crawford makes three point jumper
Jamal Crawford makes driving layup
Jamal Crawford makes 19-foot jumper
Jamal Crawford makes layup
Jamal Crawford makes 27-foot three point jumper
Jamal Crawford makes 23-foot three point jumper
Jamal Crawford makes 23-foot three point jumper
Jamal Crawford makes 27-foot three point jumper
Jamal Crawford makes running jumper
Jamal Crawford makes 12-foot two point shot
Jamal Crawford makes 25-foot three point jumper
Jamal Crawford makes 26-foot three point jumper
Jamal Crawford makes 27-foot three point jumper
Jamal Crawford makes 21-foot jumper
Jamal Crawford makes 13-foot two point shot
Jamal Crawford makes driving layup
As can be seen, these were plenty challenging shots! For whatever reason, spectacular nights of shooting from behind the three-point arc are not as rare as some might imagine. Just last year, the Bulls' Ben Gordon went a perfect 9-of-9 on treys, tying the previous NBA record of most three-point attempts without a miss, accomplished by Latrell Sprewell in 2003.
Friday, January 26, 2007

Thursday, January 25, 2007
For an athlete to exhibit a "hot hand," say by making several basketball free throws in a row (which removes the elements of variation in shot distance and defense by the other team), one of the most rudimentary aspects would be his or her ability to remember, at some level, the motoric actions exhibited on previous successful shots and reproduce them (within some margin of error).
Short of videotaping athletes' repeated shots from different angles (and perhaps with some kinds of electrodes, computer microchips, or other detectors attached to their limbs), it would be helpful to have some type of easily recordable measure of shot intensity on repeated trials. From free throws, only the hit-or-miss outcome is easily obtainable, although trajectory and launch velocity could also be gleaned with greater effort.
One potentially informative solution to our problem comes from the annual National Hockey League All-Star SuperSkills Competition, held the night before the actual All-Star Game. Of particular interest to me is the hardest shot competition, where each of the eight participants gets to take two separate whacks at the puck, and the speeds in miles per hour (mph) are revealed instantly by the television crew.
Here we can get a quantitative look -- admittedly from a small sample of players, exhibiting a fairly basic technique -- at the reproducibility of a sports action. A video of the hardest-shot contest and a results page from all of the skills competitions are both available.
I plotted the correlation between the speeds of each player's two shots, as shown below.

The linear correlation is near perfect (.88, where 1.00 is the maximum), indicating that players who really sent the puck zipping along on one of their shots also did so on their other shot, whereas those with relatively slow-moving shots on one attempt also attained similar movement on their other shot.
On this crude test, with shots taken in quick succession, slapshot speed seems highly reproducible.
Short of videotaping athletes' repeated shots from different angles (and perhaps with some kinds of electrodes, computer microchips, or other detectors attached to their limbs), it would be helpful to have some type of easily recordable measure of shot intensity on repeated trials. From free throws, only the hit-or-miss outcome is easily obtainable, although trajectory and launch velocity could also be gleaned with greater effort.
One potentially informative solution to our problem comes from the annual National Hockey League All-Star SuperSkills Competition, held the night before the actual All-Star Game. Of particular interest to me is the hardest shot competition, where each of the eight participants gets to take two separate whacks at the puck, and the speeds in miles per hour (mph) are revealed instantly by the television crew.
Here we can get a quantitative look -- admittedly from a small sample of players, exhibiting a fairly basic technique -- at the reproducibility of a sports action. A video of the hardest-shot contest and a results page from all of the skills competitions are both available.
I plotted the correlation between the speeds of each player's two shots, as shown below.

The linear correlation is near perfect (.88, where 1.00 is the maximum), indicating that players who really sent the puck zipping along on one of their shots also did so on their other shot, whereas those with relatively slow-moving shots on one attempt also attained similar movement on their other shot.
On this crude test, with shots taken in quick succession, slapshot speed seems highly reproducible.
Monday, January 22, 2007
There were streaky starts in two different basketball games tonight (actually, each was a combination of one team's "hotness" and the other's "coldness").
In the NBA, the Miami Heat -- playing without stars Dwyane Wade and Shaquille O'Neal -- outscored the New York Knicks 27-0 near the beginning of the game in taking a 29-3 lead. The Knicks closed the deficit to six points at one time, but Miami reasserted control to win 101-83.
Meanwhile, in women's college hoops, No. 1 Duke stunned a Knoxville crowd of 21,118, taking a 19-0 lead over No. 4 Tennessee. Parelleling the aforementioned Heat-Knicks game, the Lady Volunteers rallied to make the game competitive, losing by only 74-70.
Both of these games nicely illustrate the statistical principle of regression toward the mean. For series of observations, such as teams' play at various points in games, extreme initial performances (either extremely good or extremely bad) tend to come back toward the average. Thus, the teams with the torrid starts -- Miami shot at a .684 clip (13 of 19) and Duke made its first five shots, respectively -- would be expected to come down to earth a bit, whereas the teams in the deep freeze -- the Knicks missed 10 straight shots, Tennesse eight -- would be expected to start finding the basket.
Another element that I think is important to note is the relatively narrow range of talent in these games. Duke and Tennessee, of course, were both in the top four of the national women's collegiate rankings. Also, considering the full spectrum of men's pro (or semi-pro) basketball teams around the world (including the various sub-NBA leagues in the U.S. such as the NBDL and "new" ABA, and leagues in numerous other nations), the difference between NBA teams' talent levels are indeed narrow, even if the best and worst of the 30 teams were to play each other (insert your own joke here about the Knicks being an NBA team).
Comebacks (albeit unsuccessful) of the kind seen tonight would seem to be much more likely when teams of relatively comparable ability are playing. When teams are really not comparable, such as nationally ranked men's NCAA Division I Air Force and Division III Colorado College (not to be confused with D-I University of Colorado), you're likely to witness an unmitigated pulverizing. Even here though, with Air Force taking a 50-6 halftime lead, the second half was bound to be less one-sided, and indeed it was.
In the NBA, the Miami Heat -- playing without stars Dwyane Wade and Shaquille O'Neal -- outscored the New York Knicks 27-0 near the beginning of the game in taking a 29-3 lead. The Knicks closed the deficit to six points at one time, but Miami reasserted control to win 101-83.
Meanwhile, in women's college hoops, No. 1 Duke stunned a Knoxville crowd of 21,118, taking a 19-0 lead over No. 4 Tennessee. Parelleling the aforementioned Heat-Knicks game, the Lady Volunteers rallied to make the game competitive, losing by only 74-70.
Both of these games nicely illustrate the statistical principle of regression toward the mean. For series of observations, such as teams' play at various points in games, extreme initial performances (either extremely good or extremely bad) tend to come back toward the average. Thus, the teams with the torrid starts -- Miami shot at a .684 clip (13 of 19) and Duke made its first five shots, respectively -- would be expected to come down to earth a bit, whereas the teams in the deep freeze -- the Knicks missed 10 straight shots, Tennesse eight -- would be expected to start finding the basket.
Another element that I think is important to note is the relatively narrow range of talent in these games. Duke and Tennessee, of course, were both in the top four of the national women's collegiate rankings. Also, considering the full spectrum of men's pro (or semi-pro) basketball teams around the world (including the various sub-NBA leagues in the U.S. such as the NBDL and "new" ABA, and leagues in numerous other nations), the difference between NBA teams' talent levels are indeed narrow, even if the best and worst of the 30 teams were to play each other (insert your own joke here about the Knicks being an NBA team).
Comebacks (albeit unsuccessful) of the kind seen tonight would seem to be much more likely when teams of relatively comparable ability are playing. When teams are really not comparable, such as nationally ranked men's NCAA Division I Air Force and Division III Colorado College (not to be confused with D-I University of Colorado), you're likely to witness an unmitigated pulverizing. Even here though, with Air Force taking a 50-6 halftime lead, the second half was bound to be less one-sided, and indeed it was.
Thursday, January 18, 2007
An ESPN television graphic, based on NBA play through the end of last night's play, vividly demonstrates that the Dallas Mavericks (game-by-game log) and Phoenix Suns (log) are currently the hottest teams in the league.
The Mavs, after starting the season 0-4, have gone 32-4, for an overall 32-8 record entering tonight's game against the L.A. Lakers. Dallas has also won 18 of its last 19 games, the one loss coming January 7 in L.A. against the very same Lakers.
The Suns, meanwhile, after coming out of the gate 1-4, have gone 29-4, for an overall ledger of 30-8. They are 27-2 in their last 29 games.
Will these be the teams that play in the Western Conference final down the road?
The Mavs, after starting the season 0-4, have gone 32-4, for an overall 32-8 record entering tonight's game against the L.A. Lakers. Dallas has also won 18 of its last 19 games, the one loss coming January 7 in L.A. against the very same Lakers.
The Suns, meanwhile, after coming out of the gate 1-4, have gone 29-4, for an overall ledger of 30-8. They are 27-2 in their last 29 games.
Will these be the teams that play in the Western Conference final down the road?
Monday, January 15, 2007
This past Saturday, senior guard Lee Humphrey of the defending NCAA men's basketball champion Florida went 7-for-8 on three-point attempts in the Gators' 84-50 rout of conference rival South Carolina.
As I've done many times before, I want to conduct an analysis of the form, How likely is it that a player with a long-term prior success rate of X percent will proceed to make Y out of Z attempts in his or her next game? However, I want to go into a little more depth this time.
For Humphrey's prior probability of making threes, let's use .45. Looking at his career stats (which, of course, includes only part of the current season), we see that, with the exception of a .370 percentage from behind the arc his sophomore season, his other yearly percentages have clustered around .45 (.439, .459, and for this season so far, .452).
Humphrey's recent 7-of-8 performance from three-point land (.875) certainly exceeds .45. However, due to random sampling error, he is unlikely to hit at exactly a .45 clip in every game. The logic is the same as saying that, even though we know the probability of a tossed coin coming up heads is .50, repeated sets of ten tosses would likely yield something other than five heads and five tails for many of the sequences (sometimes more than five heads, sometimes fewer than five heads). The question then becomes, how incompatible is a 7-of-8 performance with an underlying .45 prior probability?
At this time, I usually bring in an online binomial calculator from Vassar College, and I do so again. By plugging in just three values -- number of attempts, n; number of stipulated successes, k; and probability of a success, p -- we can answer questions such as what's the probability of a prior .45 shooter making exactly 7 three-point attempts out of 8, and what's the probability of him or her making 7 or more out of 8?
(Statisticians would generally be more interested in the latter type of question -- probability of a particular value or more extreme -- than the former, as chances tend to be very low for any single, particular number of successes. For purposes of our analyses, however, we will need to look at probabilities of particular numbers of successes.)
By plugging in the full range of values from 0 to 8 for k, we can see the probabilities of making exactly 0, 1, 2, 3, etc., three-point shots, up to 8. These probabilities, which must sum to 1.0, are illustrated in the figure below.

As can be seen, with a .45 prior shooting percentage from behind the arc and eight shots taken, the most likely outcomes would be either three or four made shots. However, more or fewer made shots than that also have some non-ignorable probabilities.
At the extremes, these probabilities are fairly simple to compute, but get a bit more complicated in the middle of the distribution. A simple analogy would be to calculating the probability of double sixes on a roll of two dice by taking (1/6) squared, or 1/36 (all illustrations in this write-up assume independence of observations, as with dice, which has been shown to be a surprisingly reasonable assumption for sequential sports performances).
For a perfect 8-of-8 successes, the probability is simply (.45)^8, where ^ signifies raising to a power. Raising .45 to the eighth power yields .0017.
The basic probability of an exactly 7-of-8 sequence is computed according to...
(.45)^7 X (.55), which equals .0021 (.45 gets multiplied by itself seven times to represent the made shots, whereas the .55 represents the missed shot).
There are, however, eight different ways to make 7-of-8 shots. The one miss can occur on either the first shot, the second shot, etc., up through the eighth shot. We thus multiply .0021 X 8, yielding .0164.
The probability of making 7 or more out of 8 is thus .0017 + .0164 = .0181, or nearly 2 percent (1 in 50). If a .45 three-point shooter can play around 130 games over a four-year collegiate career, as Humphrey seems on pace to do, he or she might then be expected to have two or three games of making 7 or 8 threes in 8 attempts, purely on the basis of statistical fluctuation.
The probability of making exactly 6 out of 8 is (.45)^6 X (.55)^2, multiplied by the number of ways to make six shots. The number of ways gets pretty large in a hurry (i.e., missing shots 1 & 2, 1 & 3, etc., up through 1 & 8; missing shots 2 & 3, 2 & 4, etc., up through 2 & 8; and so forth). Similar reasoning applies for calculating the probability of making 5 of 8, 4 of 8, etc. See my Intro Stats lecture on this topic for further detail.
***
I also wanted to discuss, briefly, two other games from this past Saturday, one involving my undergraduate alma mater UCLA (vs. USC) and the other involving the university at which I'm on the faculty, Texas Tech (vs. Baylor).
In this year's first installment of the Battle of Los Angeles, USC got the ball with less than a minute remaining, trailing 63-57 (see play-by-play sheet). Under the most realistic scenario for the Trojans to tie the game, three things had to happen: they'd have to make a three, hold UCLA scoreless on its possession, then hit another three. Gabe Pruitt (whom we'll generously consider a .40 shooter from behind the arc, based mostly on previous seasons) and Nick Young (hitting about .45 from three-point land this season, but in the low .30s in previous years, so let's say .40 overall) did their part, hitting the two treys.
In between its two final possessions, USC fouled UCLA's Lorenzo Mata, a roughly .30 free-throw shooter this season, although a .50 and above shooter from the line in earlier seasons. Again for simplicity, let's assume a .40 FT% for Mata, which, conversely, is a .60 miss rate. There would thus be a .36 probability of Mata's missing both free throws. If you want to use .30 as his FT% and .70 as his miss rate, there would be a .49 probability of his missing both.
Mata indeed missed both free throws.
The probability of an 'SC three, Mata missing two from the stripe, and another 'SC three all happening in sequence would thus be .40 X .36 X .40 = .06 (or, if you prefer, .40 X .49 X .40 = .08).
There was one more "shoe to drop," however. Young was fouled on his three-point attempt and made the free throw for a rare four-point play, putting the Trojans up 64-63. I don't know the frequency of fouls on three-point attempts -- which would also have to be incorporated into the calculation -- but I would imagine it's pretty rare. Thus, unless we find out how often fouls on three-point attempts occur, we can say that the probability of USC taking the lead was incalculably small.
Ultimately, the Bruins still had some time on the clock after falling behind by a point, and Arron Afflalo hit a Michael Jordan-esque clutch shot from near the top of the key with four seconds remaining, to give UCLA the win, 65-64.
Finally, a surprising offensive force for Texas Tech in its 73-70 loss to Baylor was 6-8 forward Jon Plefka, who had not made any more than four field goals in a game previously this season. In the second half of the Baylor game, he made seven straight field goal attempts, some from outside including a three (box score and play-by-play document). Plefka will probably be receiving more playing time, so we can track any tendency of his for streak shooting.
As I've done many times before, I want to conduct an analysis of the form, How likely is it that a player with a long-term prior success rate of X percent will proceed to make Y out of Z attempts in his or her next game? However, I want to go into a little more depth this time.
For Humphrey's prior probability of making threes, let's use .45. Looking at his career stats (which, of course, includes only part of the current season), we see that, with the exception of a .370 percentage from behind the arc his sophomore season, his other yearly percentages have clustered around .45 (.439, .459, and for this season so far, .452).
Humphrey's recent 7-of-8 performance from three-point land (.875) certainly exceeds .45. However, due to random sampling error, he is unlikely to hit at exactly a .45 clip in every game. The logic is the same as saying that, even though we know the probability of a tossed coin coming up heads is .50, repeated sets of ten tosses would likely yield something other than five heads and five tails for many of the sequences (sometimes more than five heads, sometimes fewer than five heads). The question then becomes, how incompatible is a 7-of-8 performance with an underlying .45 prior probability?
At this time, I usually bring in an online binomial calculator from Vassar College, and I do so again. By plugging in just three values -- number of attempts, n; number of stipulated successes, k; and probability of a success, p -- we can answer questions such as what's the probability of a prior .45 shooter making exactly 7 three-point attempts out of 8, and what's the probability of him or her making 7 or more out of 8?
(Statisticians would generally be more interested in the latter type of question -- probability of a particular value or more extreme -- than the former, as chances tend to be very low for any single, particular number of successes. For purposes of our analyses, however, we will need to look at probabilities of particular numbers of successes.)
By plugging in the full range of values from 0 to 8 for k, we can see the probabilities of making exactly 0, 1, 2, 3, etc., three-point shots, up to 8. These probabilities, which must sum to 1.0, are illustrated in the figure below.

As can be seen, with a .45 prior shooting percentage from behind the arc and eight shots taken, the most likely outcomes would be either three or four made shots. However, more or fewer made shots than that also have some non-ignorable probabilities.
At the extremes, these probabilities are fairly simple to compute, but get a bit more complicated in the middle of the distribution. A simple analogy would be to calculating the probability of double sixes on a roll of two dice by taking (1/6) squared, or 1/36 (all illustrations in this write-up assume independence of observations, as with dice, which has been shown to be a surprisingly reasonable assumption for sequential sports performances).
For a perfect 8-of-8 successes, the probability is simply (.45)^8, where ^ signifies raising to a power. Raising .45 to the eighth power yields .0017.
The basic probability of an exactly 7-of-8 sequence is computed according to...
(.45)^7 X (.55), which equals .0021 (.45 gets multiplied by itself seven times to represent the made shots, whereas the .55 represents the missed shot).
There are, however, eight different ways to make 7-of-8 shots. The one miss can occur on either the first shot, the second shot, etc., up through the eighth shot. We thus multiply .0021 X 8, yielding .0164.
The probability of making 7 or more out of 8 is thus .0017 + .0164 = .0181, or nearly 2 percent (1 in 50). If a .45 three-point shooter can play around 130 games over a four-year collegiate career, as Humphrey seems on pace to do, he or she might then be expected to have two or three games of making 7 or 8 threes in 8 attempts, purely on the basis of statistical fluctuation.
The probability of making exactly 6 out of 8 is (.45)^6 X (.55)^2, multiplied by the number of ways to make six shots. The number of ways gets pretty large in a hurry (i.e., missing shots 1 & 2, 1 & 3, etc., up through 1 & 8; missing shots 2 & 3, 2 & 4, etc., up through 2 & 8; and so forth). Similar reasoning applies for calculating the probability of making 5 of 8, 4 of 8, etc. See my Intro Stats lecture on this topic for further detail.
***
I also wanted to discuss, briefly, two other games from this past Saturday, one involving my undergraduate alma mater UCLA (vs. USC) and the other involving the university at which I'm on the faculty, Texas Tech (vs. Baylor).
In this year's first installment of the Battle of Los Angeles, USC got the ball with less than a minute remaining, trailing 63-57 (see play-by-play sheet). Under the most realistic scenario for the Trojans to tie the game, three things had to happen: they'd have to make a three, hold UCLA scoreless on its possession, then hit another three. Gabe Pruitt (whom we'll generously consider a .40 shooter from behind the arc, based mostly on previous seasons) and Nick Young (hitting about .45 from three-point land this season, but in the low .30s in previous years, so let's say .40 overall) did their part, hitting the two treys.
In between its two final possessions, USC fouled UCLA's Lorenzo Mata, a roughly .30 free-throw shooter this season, although a .50 and above shooter from the line in earlier seasons. Again for simplicity, let's assume a .40 FT% for Mata, which, conversely, is a .60 miss rate. There would thus be a .36 probability of Mata's missing both free throws. If you want to use .30 as his FT% and .70 as his miss rate, there would be a .49 probability of his missing both.
Mata indeed missed both free throws.
The probability of an 'SC three, Mata missing two from the stripe, and another 'SC three all happening in sequence would thus be .40 X .36 X .40 = .06 (or, if you prefer, .40 X .49 X .40 = .08).
There was one more "shoe to drop," however. Young was fouled on his three-point attempt and made the free throw for a rare four-point play, putting the Trojans up 64-63. I don't know the frequency of fouls on three-point attempts -- which would also have to be incorporated into the calculation -- but I would imagine it's pretty rare. Thus, unless we find out how often fouls on three-point attempts occur, we can say that the probability of USC taking the lead was incalculably small.
Ultimately, the Bruins still had some time on the clock after falling behind by a point, and Arron Afflalo hit a Michael Jordan-esque clutch shot from near the top of the key with four seconds remaining, to give UCLA the win, 65-64.
Finally, a surprising offensive force for Texas Tech in its 73-70 loss to Baylor was 6-8 forward Jon Plefka, who had not made any more than four field goals in a game previously this season. In the second half of the Baylor game, he made seven straight field goal attempts, some from outside including a three (box score and play-by-play document). Plefka will probably be receiving more playing time, so we can track any tendency of his for streak shooting.
Thursday, January 11, 2007
The Texas Tech Lady Raider basketball team lost 49-47 to nationally ranked Texas A&M last night. Intensifying the frustration, no doubt, was Texas Tech's 9-of-22 performance at the free-throw line.
Including the A&M game, Texas Tech is 233-339 (.69) on free throws, but subtracting the 9 for 22 to get a "prior" estimate yields 224-317 (.71).
Using an online calculator for this type of problem (known as a binomial distribution), we find that for a team with a long-term percentage of hitting free throws at .71, its probability of then making nine (or fewer) out of 22 is only .003, or three in a thousand.
One issue often raised in connection with this type of analysis is whether, perhaps, the team's poorest free-throw shooters got to the line disproportionately often. Thus, it would not be that the team got cold at the stripe across the board, but rather that each player shot to his or her normal level and it was only the poor free-throw shooters' increased attempts that knocked the team's average down.
A few things would argue against such an interpretation, in my view.
First, the two Lady Raiders who shot the most free throws against A&M were, respectively, first and (roughly) tied for second in this category for the season to this point.
Second, in an analysis of Kansas's 12-of-30 free-throw shooting in the 2003 NCAA men's championship game against Syracuse -- where I initially got the ball rolling and then Ken Pomeroy came along and did a much more elaborate study -- the finding that the Jayhawks had an excessively poor night from the stripe was pretty robust, regardless of whether adjustments were made for which individual players took precisely how many FT attempts in the title game. (Note: In Ken's analysis, you'll see where he put in a link to my initial study; mine is no longer available online, as it was on the old version of my Hot Hand page, before I switched to blog format. Ken's summary of my analysis should be sufficient, however.)
Including the A&M game, Texas Tech is 233-339 (.69) on free throws, but subtracting the 9 for 22 to get a "prior" estimate yields 224-317 (.71).
Using an online calculator for this type of problem (known as a binomial distribution), we find that for a team with a long-term percentage of hitting free throws at .71, its probability of then making nine (or fewer) out of 22 is only .003, or three in a thousand.
One issue often raised in connection with this type of analysis is whether, perhaps, the team's poorest free-throw shooters got to the line disproportionately often. Thus, it would not be that the team got cold at the stripe across the board, but rather that each player shot to his or her normal level and it was only the poor free-throw shooters' increased attempts that knocked the team's average down.
A few things would argue against such an interpretation, in my view.
First, the two Lady Raiders who shot the most free throws against A&M were, respectively, first and (roughly) tied for second in this category for the season to this point.
Second, in an analysis of Kansas's 12-of-30 free-throw shooting in the 2003 NCAA men's championship game against Syracuse -- where I initially got the ball rolling and then Ken Pomeroy came along and did a much more elaborate study -- the finding that the Jayhawks had an excessively poor night from the stripe was pretty robust, regardless of whether adjustments were made for which individual players took precisely how many FT attempts in the title game. (Note: In Ken's analysis, you'll see where he put in a link to my initial study; mine is no longer available online, as it was on the old version of my Hot Hand page, before I switched to blog format. Ken's summary of my analysis should be sufficient, however.)
Tuesday, January 09, 2007
Revisiting the 1971-72 Lakers' 33-Game Winning Streak
Today is the 35th anniversary of the ending of the Los Angeles Lakers' 33-game winning streak, the longest winning streak in major American professional team sports. A game-by-game log of that season, from Basketball Reference, is available here, whereas a narrative of the games during the streak, from Sports Illustrated, is available here. To mark the occasion, let's look back at that Laker team, both historically and statistically. First, here's a commemorative team picture that I recently found in my room at my parents' home in Los Angeles:

In retrospect, it's hard to imagine that the 1971-72 Lakers would dominate the NBA the way they did, with their 33-game winning streak, 69-13 regular-season ledger (an NBA record at the time), and relatively easy march through the play-offs (with no series closer than 4-2).
The Lakers had lost the NBA finals in 1968, '69, and '70, and then were eliminated in the next year's Western Conference finals as the Milwaukee Bucks -- a relatively new franchise, now featuring young star center Lew Alcindor (later Kareem Abdul-Jabbar) -- romped to the '71 NBA title.
By the start of the 1971-72 season, then, the Lakers probably would have struck most observers as an over-the-hill team (I'm inferring this after the fact, as I was only 9 years old at the time of the streak and not very sophisticated regarding players' peak performance years). Although center Wilt Chamberlain and guard Jerry West were still productive, years of knee injuries appeared to be catching up with veteran forward Elgin Baylor. The Lakers did have one newcomer who had the potential to breathe new life into the team, Coach Bill Sharman.
According to Charley Rosen's (2005) book about the 1971-72 Lakers, entitled The Pivotal Season, the Lakers started out pretty well, but there was a feeling that Baylor was holding them back. Writes Rosen, "Baylor was selfish and defenseless... There was only one thing for Sharman to do -- arrange a retirement party for Baylor" (p. 97).
(I personally found the book useful for reminding me of key points in the streak, but according to a review at Amazon.com, the book appears to have quite a few factual errors in its details.)
In fact, it was immediately after Baylor's departure that the Lakers began their streak, beating Baltimore 110-106. Along the way, the Lakers surpassed the previous NBA record winning streak -- 20 games, set the year before by none other than Milwaukee -- and the previous pro sport record of 26 straight wins by the 1916 New York (Baseball) Giants.
In addition to being the previous year's NBA champion and holding the previous NBA record winning streak, the ubiquitous Milwaukee Bucks had another place in the story, spanking the visiting Lakers 120-104 on January 9, 1972 to end L.A.'s victory streak at 33 games.
As those of you who are longtime readers of the Hot Hand page know, to estimate the probability of a perfect sequential run, we multiply the probabilities of the individual components (wins). If there were a uniform probability of the Lakers' winning each game (the way a coin always has a .50 probability of being a head), we would raise that probability to the 33rd power.
However, the 33 games in the streak would obviously have varied in their degree of difficulty. To account for this, I adopted a very simple model that pegged the difficulty of each game on whether the Lakers were at home or away and on the opponent's winning percentage from the previous season (the streak occurred early in the 1971-72 season, so same-season record probably wouldn't have added much).
Based on opposing teams' 1970-71 winning percentages, I created four classes of difficulty. The Bucks' .805 percentage put them in a class by themselves, which I called Group A. Six teams' percentages clustered within .537-.634, so I called this Group B. Another five teams' percentages ranged from .439-.512, so they were Group C. Finally, three teams that were first-year expansion franchises in 1970-71 -- Buffalo (later the Clippers), Cleveland, and Portland -- had winning percentages from .183-.354, thus constituting Group D. The Lakers did not play the remaining team, Cincinnati (later Sacramento), during the streak.
Then what I did was assign (assumed) Laker win probabilities to the 33 games based on the following rules:
D opponent at home for Lakers ---> .90
D opponent on the road ---> .85
C opponent at home ---> .80
C on road or B at home ---> .75
B opponent on road ---> .70
A opponent at home ---> .65
A opponent on road ---> .60
I purposely tried to err in the direction of making these probabilities too high, so that the product of the 33 probabilities would not be overly small. For what it's worth, my estimate of the overall probability of the Lakers winning all 33 of the games they did during the streak is...
.0002, or 1 in 5,000.
Consider the following:
*The NBA has been around for about 60 years.
*There are currently 30 NBA teams, and there have been at least 22 teams during the past 30 years.
*For as long as I can remember, each team has played 82 games per season, which creates a lot of theoretical opportunities for a team to start a 33-game winning streak (such a streak could be started after each loss).
Without doing any more math, it looks to me that over the entire history of the NBA, there would probably be several thousand opportunities for such a streak. Thus, the Lakers' streak might not be that far out of line.
Contemporary observers would probably cite travel as a factor for why a team would be unlikely to win 33 straight games today. However, if you look at the '71-'72 Lakers' game-by-game log at one of the above links, you'll see that from December 17-22, they played five games in six nights (including three straight nights), which is not done anymore. In fact, I don't believe the current NBA schedule allows a team to play any more than two nights in a row. And remember the Lakers' aging roster!
Another aspect to look at is the Lakers' margins of victory during the streak. They had one overtime game, December 10 against Phoenix. Other than that, the point differentials were distributed as follows:
*9 games won by 4-9 points
*15 games won by 10-19 points
*5 games won by 20-29 points
*3 games won by 30 or more
[A slight error in these margin-of-victory frequencies was corrected on 1/16/11.]
On the whole, the Lakers' victory margins were pretty healthy, so they may have been able to conserve some energy by blowing away some teams early.
Finally, if you want to see another perspective, I would recommend this piece by Gabe Farkas at Courtside Times. Although Farkas starts out discussing the super-streaky Laker squad, he ultimately uses the 1995-96 season, in which the Chicago Bulls surpassed the '71-'72 Lakers' 69-13 record by going 72-10, for his major analyses.

In retrospect, it's hard to imagine that the 1971-72 Lakers would dominate the NBA the way they did, with their 33-game winning streak, 69-13 regular-season ledger (an NBA record at the time), and relatively easy march through the play-offs (with no series closer than 4-2).
The Lakers had lost the NBA finals in 1968, '69, and '70, and then were eliminated in the next year's Western Conference finals as the Milwaukee Bucks -- a relatively new franchise, now featuring young star center Lew Alcindor (later Kareem Abdul-Jabbar) -- romped to the '71 NBA title.
By the start of the 1971-72 season, then, the Lakers probably would have struck most observers as an over-the-hill team (I'm inferring this after the fact, as I was only 9 years old at the time of the streak and not very sophisticated regarding players' peak performance years). Although center Wilt Chamberlain and guard Jerry West were still productive, years of knee injuries appeared to be catching up with veteran forward Elgin Baylor. The Lakers did have one newcomer who had the potential to breathe new life into the team, Coach Bill Sharman.
According to Charley Rosen's (2005) book about the 1971-72 Lakers, entitled The Pivotal Season, the Lakers started out pretty well, but there was a feeling that Baylor was holding them back. Writes Rosen, "Baylor was selfish and defenseless... There was only one thing for Sharman to do -- arrange a retirement party for Baylor" (p. 97).
(I personally found the book useful for reminding me of key points in the streak, but according to a review at Amazon.com, the book appears to have quite a few factual errors in its details.)
In fact, it was immediately after Baylor's departure that the Lakers began their streak, beating Baltimore 110-106. Along the way, the Lakers surpassed the previous NBA record winning streak -- 20 games, set the year before by none other than Milwaukee -- and the previous pro sport record of 26 straight wins by the 1916 New York (Baseball) Giants.
In addition to being the previous year's NBA champion and holding the previous NBA record winning streak, the ubiquitous Milwaukee Bucks had another place in the story, spanking the visiting Lakers 120-104 on January 9, 1972 to end L.A.'s victory streak at 33 games.
As those of you who are longtime readers of the Hot Hand page know, to estimate the probability of a perfect sequential run, we multiply the probabilities of the individual components (wins). If there were a uniform probability of the Lakers' winning each game (the way a coin always has a .50 probability of being a head), we would raise that probability to the 33rd power.
However, the 33 games in the streak would obviously have varied in their degree of difficulty. To account for this, I adopted a very simple model that pegged the difficulty of each game on whether the Lakers were at home or away and on the opponent's winning percentage from the previous season (the streak occurred early in the 1971-72 season, so same-season record probably wouldn't have added much).
Based on opposing teams' 1970-71 winning percentages, I created four classes of difficulty. The Bucks' .805 percentage put them in a class by themselves, which I called Group A. Six teams' percentages clustered within .537-.634, so I called this Group B. Another five teams' percentages ranged from .439-.512, so they were Group C. Finally, three teams that were first-year expansion franchises in 1970-71 -- Buffalo (later the Clippers), Cleveland, and Portland -- had winning percentages from .183-.354, thus constituting Group D. The Lakers did not play the remaining team, Cincinnati (later Sacramento), during the streak.
Then what I did was assign (assumed) Laker win probabilities to the 33 games based on the following rules:
D opponent at home for Lakers ---> .90
D opponent on the road ---> .85
C opponent at home ---> .80
C on road or B at home ---> .75
B opponent on road ---> .70
A opponent at home ---> .65
A opponent on road ---> .60
I purposely tried to err in the direction of making these probabilities too high, so that the product of the 33 probabilities would not be overly small. For what it's worth, my estimate of the overall probability of the Lakers winning all 33 of the games they did during the streak is...
.0002, or 1 in 5,000.
Consider the following:
*The NBA has been around for about 60 years.
*There are currently 30 NBA teams, and there have been at least 22 teams during the past 30 years.
*For as long as I can remember, each team has played 82 games per season, which creates a lot of theoretical opportunities for a team to start a 33-game winning streak (such a streak could be started after each loss).
Without doing any more math, it looks to me that over the entire history of the NBA, there would probably be several thousand opportunities for such a streak. Thus, the Lakers' streak might not be that far out of line.
Contemporary observers would probably cite travel as a factor for why a team would be unlikely to win 33 straight games today. However, if you look at the '71-'72 Lakers' game-by-game log at one of the above links, you'll see that from December 17-22, they played five games in six nights (including three straight nights), which is not done anymore. In fact, I don't believe the current NBA schedule allows a team to play any more than two nights in a row. And remember the Lakers' aging roster!
Another aspect to look at is the Lakers' margins of victory during the streak. They had one overtime game, December 10 against Phoenix. Other than that, the point differentials were distributed as follows:
*9 games won by 4-9 points
*15 games won by 10-19 points
*5 games won by 20-29 points
*3 games won by 30 or more
[A slight error in these margin-of-victory frequencies was corrected on 1/16/11.]
On the whole, the Lakers' victory margins were pretty healthy, so they may have been able to conserve some energy by blowing away some teams early.
Finally, if you want to see another perspective, I would recommend this piece by Gabe Farkas at Courtside Times. Although Farkas starts out discussing the super-streaky Laker squad, he ultimately uses the 1995-96 season, in which the Chicago Bulls surpassed the '71-'72 Lakers' 69-13 record by going 72-10, for his major analyses.
Sunday, January 07, 2007
The California Institute of Technology (CalTech) ended its 207-game, 11-year losing streak in men's NCAA Division III basketball with a win over Bard College on Saturday night.
One might expect people at CalTech to have thought a lot about the streak, from the odds of the team finally winning a game to the physics of how to launch a successful shot at the basket. Indeed, as I just found during some web searching, Professor Colin Camerer has done some research on hot and cold hands, although not necessarily related to his own school's team. To learn about this research, go to Professor Camerer's faculty webpage, then scroll down to the section entitled, "Research background and details," and, finally, click on "Field studies: Cabs and basketball."
Also, Dean Oliver, author of the book Basketball on Paper and a statistical consultant for the Seattle SuperSonics, once played point guard for CalTech.
In honor of this occasion, I'll end with a cheer I also just discovered on the web. Variations of this cheer are said to have used by MIT, CalTech, and other quantitatively advanced schools:
E to the u du dx,
E to the x, dx.
Cosine, secant, tangent, sine,
3 point 1 4 1 5 9.
Integral, radical, mu, dv
Slipstick, sliderule, MIT!
One might expect people at CalTech to have thought a lot about the streak, from the odds of the team finally winning a game to the physics of how to launch a successful shot at the basket. Indeed, as I just found during some web searching, Professor Colin Camerer has done some research on hot and cold hands, although not necessarily related to his own school's team. To learn about this research, go to Professor Camerer's faculty webpage, then scroll down to the section entitled, "Research background and details," and, finally, click on "Field studies: Cabs and basketball."
Also, Dean Oliver, author of the book Basketball on Paper and a statistical consultant for the Seattle SuperSonics, once played point guard for CalTech.
In honor of this occasion, I'll end with a cheer I also just discovered on the web. Variations of this cheer are said to have used by MIT, CalTech, and other quantitatively advanced schools:
E to the u du dx,
E to the x, dx.
Cosine, secant, tangent, sine,
3 point 1 4 1 5 9.
Integral, radical, mu, dv
Slipstick, sliderule, MIT!
Saturday, January 06, 2007
In my December 16, 2006 entry, I mentioned a game around that time in which the New Jersey Nets failed to take advantage of an 18-0 lead over Boston, in falling to the Celtics.
Well, last night, the Nets fell behind 18-0 to the Chicago Bulls and, you guessed it, came back and won.
We've all heard expressions such as, "Things even out in the end," and, "What goes around comes around." That's what's happened to the Nets, albeit with unusual exactitude!
Well, last night, the Nets fell behind 18-0 to the Chicago Bulls and, you guessed it, came back and won.
We've all heard expressions such as, "Things even out in the end," and, "What goes around comes around." That's what's happened to the Nets, albeit with unusual exactitude!
Wednesday, January 03, 2007
With its loss (41-14 to LSU) in tonight's Sugar Bowl, Notre Dame has just set a new record by falling in its ninth straight football bowl game. A chart listing all Fighting Irish bowl games in school history is available on the Wikipedia's Notre Dame football page.
Notre Dame had shared the record for consecutive bowl losses at eight with West Virginia and South Carolina. My graduate school alma mater, the University of Michigan, once lost seven straight bowls.
I think it's fair to say that, at least as a rough approximation, bowl match-ups are created to make the games competitive. Of this season's 32 bowl games, I count 19 in which the two teams either came in with the same number of losses or differed by only one loss.
If we assume each bowl game is a 50/50 proposition as to who will win, then the probability of a team losing nine straight is (1/2) raised to the 9th power, which is 1/512. It's the same logic by which the probability of rolling double sixes with dice is (1/6) X (1/6) or 1/36; the probability of a given outcome on one iteration is raised to the power corresponding to the length of the streak.
A theory that I (and others) have come up with is that Notre Dame bowl games often are not 50/50 propositions because the school's popularity and mystique (Knute Rockne, the Four Horsemen, the Golden Dome, the exclusive contract with NBC, etc.) gets it in bowl games above its ability level. I did a little searching for articles on Notre Dame's recent bowl games and, indeed, the Irish has tended to be the underdog.
Even if we assume the Irish had only a 40% chance of winning any given bowl game (which translates into a 60% chance of losing a given game), the probability of nine straight bowl losses can be estimated at (.60) to the 9th power, or .01 (1 in 100).
Notre Dame had shared the record for consecutive bowl losses at eight with West Virginia and South Carolina. My graduate school alma mater, the University of Michigan, once lost seven straight bowls.
I think it's fair to say that, at least as a rough approximation, bowl match-ups are created to make the games competitive. Of this season's 32 bowl games, I count 19 in which the two teams either came in with the same number of losses or differed by only one loss.
If we assume each bowl game is a 50/50 proposition as to who will win, then the probability of a team losing nine straight is (1/2) raised to the 9th power, which is 1/512. It's the same logic by which the probability of rolling double sixes with dice is (1/6) X (1/6) or 1/36; the probability of a given outcome on one iteration is raised to the power corresponding to the length of the streak.
A theory that I (and others) have come up with is that Notre Dame bowl games often are not 50/50 propositions because the school's popularity and mystique (Knute Rockne, the Four Horsemen, the Golden Dome, the exclusive contract with NBC, etc.) gets it in bowl games above its ability level. I did a little searching for articles on Notre Dame's recent bowl games and, indeed, the Irish has tended to be the underdog.
Even if we assume the Irish had only a 40% chance of winning any given bowl game (which translates into a 60% chance of losing a given game), the probability of nine straight bowl losses can be estimated at (.60) to the 9th power, or .01 (1 in 100).
Friday, December 29, 2006
A couple of months ago, Michigan State set an NCAA Division I-A football record for the greatest deficit overcome (35 points), in a game against Northwestern.
Tonight, Texas Tech reeled off an amazing comeback of its own, overcoming a 31-point deficit (38-7) to stun Minnesota 44-41 in overtime in the Tempe, Arizona-based Insight Bowl. The Red Raiders' rally set a bowl record for comebacks.
Interestingly, Michigan State and Texas Tech started their respective comebacks with similar amounts of time remaining. Northwestern scored on MSU to take a 38-3 lead with 9:54 left in the third quarter, whereas Minnesota went up 38-7 over TTU with 7:47 remaining in the third. It really looked like the Gophers had burrowed too deep a hole for the Red Raiders to climb out of.
One possible way to approach the Texas Tech comeback statistically is via the runs test. If we looked at the temporal sequence of the teams' scoring drives (whether for a touchdown or field goal) in regulation, it would look like this (M = Minnesota, T = Texas Tech):
M M M M T M M T T T T T
As can be seen from the color scheme, there were four "runs" in the sequence (a run being a stretch of one team scoring points without interruption by the other team). The fewer the runs, the more streakiness is present. I tested the Minnesota-Texas Tech sequence using an online runs-test calculator, typing in 1's instead of M's for Minnesota and 0's instead of T's for Texas Tech.
As explained in this document from North Carolina State University, the runs test determines how many runs would be expected by chance (which can then be compared to the actual number obtained), "given the proportion of the population in each of the two categories and given the sample size..."
In the Minnesota-Texas Tech analysis, there were significantly fewer runs than would be expected by chance (p < .05). One probably does not need a statistical test to be convinced that Texas Tech ended regulation play on a hot streak and Minnesota, on a cold one. Still, if you had never heard of the runs test before tonight, then the saying that, "You learn something every day," holds true, at least for tonight.
Tonight, Texas Tech reeled off an amazing comeback of its own, overcoming a 31-point deficit (38-7) to stun Minnesota 44-41 in overtime in the Tempe, Arizona-based Insight Bowl. The Red Raiders' rally set a bowl record for comebacks.
Interestingly, Michigan State and Texas Tech started their respective comebacks with similar amounts of time remaining. Northwestern scored on MSU to take a 38-3 lead with 9:54 left in the third quarter, whereas Minnesota went up 38-7 over TTU with 7:47 remaining in the third. It really looked like the Gophers had burrowed too deep a hole for the Red Raiders to climb out of.
One possible way to approach the Texas Tech comeback statistically is via the runs test. If we looked at the temporal sequence of the teams' scoring drives (whether for a touchdown or field goal) in regulation, it would look like this (M = Minnesota, T = Texas Tech):
M M M M T M M T T T T T
As can be seen from the color scheme, there were four "runs" in the sequence (a run being a stretch of one team scoring points without interruption by the other team). The fewer the runs, the more streakiness is present. I tested the Minnesota-Texas Tech sequence using an online runs-test calculator, typing in 1's instead of M's for Minnesota and 0's instead of T's for Texas Tech.
As explained in this document from North Carolina State University, the runs test determines how many runs would be expected by chance (which can then be compared to the actual number obtained), "given the proportion of the population in each of the two categories and given the sample size..."
In the Minnesota-Texas Tech analysis, there were significantly fewer runs than would be expected by chance (p < .05). One probably does not need a statistical test to be convinced that Texas Tech ended regulation play on a hot streak and Minnesota, on a cold one. Still, if you had never heard of the runs test before tonight, then the saying that, "You learn something every day," holds true, at least for tonight.
Thursday, December 21, 2006
Every so often, one hears a reference to a coach or manager making a decision according to "the book," as though a definitive catalog of strategy for a given sport existed. Now, however, a trio of baseball authors has come along and written a volume entitled, appropriately enough, The Book, and they have a website to go with it.
The website has a blog component, whose topics include streakiness. It is through this blog that I learned about an online discussion on another board, where a contributor with the moniker "Dackle2" presented some statistics on what happens after baseball teams go through a particularly hot or cold 10-game stretch.
What looks like around 300,000 10-game sequences in Major League Baseball from 1871-2005 were extracted and classified according to teams' records during the stretch (i.e., from 0-10, 1-9, and 2-8 all the way through to 8-2, 9-1, and 10-0). Teams' winning percentages from the five games before and five games after the 10-game stretch were also noted.
If there were anything to the idea of momentum or carryover of streakiness, one would predict, for example, that after languishing through a 0-10 cold streak, teams would have an appreciably worse winning percentage in the five games after the 10-game losing streak than in the five games before. Five games, by themselves, do not constitute a great sample, but aggregating many five-game sequences over many teams and many years, the data would seem sufficient.
As seen in the linked document, however, teams did not play markedly worse immediately after their 0-10 stretches (.347) than they did immediately before them (.358). At the other extreme, teams that achieved 10-0 hot streaks did not play substantially better immediately afterwards (.620) than beforehand (.610). In fact, whichever 10-game breakdown you look at (e.g., 2-8, 5-5, 7-3), the average winning percentages for the five games before and five games after are virtually identical.
Like other studies going all the way back to the original "hot hand" research by Gilovich, Vallone, and Tversky in 1985, the present findings suggest that players and teams have characteristic baseline rates of success, and that short-term hot streaks do not lead to long-term success rates above baseline, nor do short-term cold streaks lead to long-term success rates below baseline.
The website has a blog component, whose topics include streakiness. It is through this blog that I learned about an online discussion on another board, where a contributor with the moniker "Dackle2" presented some statistics on what happens after baseball teams go through a particularly hot or cold 10-game stretch.
What looks like around 300,000 10-game sequences in Major League Baseball from 1871-2005 were extracted and classified according to teams' records during the stretch (i.e., from 0-10, 1-9, and 2-8 all the way through to 8-2, 9-1, and 10-0). Teams' winning percentages from the five games before and five games after the 10-game stretch were also noted.
If there were anything to the idea of momentum or carryover of streakiness, one would predict, for example, that after languishing through a 0-10 cold streak, teams would have an appreciably worse winning percentage in the five games after the 10-game losing streak than in the five games before. Five games, by themselves, do not constitute a great sample, but aggregating many five-game sequences over many teams and many years, the data would seem sufficient.
As seen in the linked document, however, teams did not play markedly worse immediately after their 0-10 stretches (.347) than they did immediately before them (.358). At the other extreme, teams that achieved 10-0 hot streaks did not play substantially better immediately afterwards (.620) than beforehand (.610). In fact, whichever 10-game breakdown you look at (e.g., 2-8, 5-5, 7-3), the average winning percentages for the five games before and five games after are virtually identical.
Like other studies going all the way back to the original "hot hand" research by Gilovich, Vallone, and Tversky in 1985, the present findings suggest that players and teams have characteristic baseline rates of success, and that short-term hot streaks do not lead to long-term success rates above baseline, nor do short-term cold streaks lead to long-term success rates below baseline.
Saturday, December 16, 2006
One of the more interesting forms of streakiness, in my view, is seeing one team go on a run to build up a big lead, only to see the other team turn the tables and make its own spurt to come back and win the game, or at least make it close.
Last night alone in the NBA, there were at least four games that followed the above storyline:
Phoenix built a 47-22 lead over Golden State in the second quarter, only to see the Warriors rebound for an 80-72 lead (a 33-point turnaround from -25 to +8 on Golden State's part). Unfazed by blowing their huge lead, however, the Suns came back to win the game, their 13th straight victory.
Philly shaved a 17-point Dallas lead to just 3, although the Mavs pulled away again. It was the Sixers' 10th straight loss; Dallas had a 12-game winning streak earlier this season.
Sacramento erased a 16-point deficit to edge Utah.
Finally, in the late West Coast game, the Lakers came back from 21 behind to beat the Rockets.
A week ago, the Nets darted out to an 18-0 lead, but fell to Boston.
This recent lead-blowing even appears to transcend any particular sport. In NHL action last Monday, Washington squandered a 4-0 lead in falling to Pittsburgh 5-4.
The above scenarios were all that I planned to write about. But right now, upon checking the score of the Texas Tech-Arkansas men's basketball game, I see where the Red Raiders have jumped out to an 18-3 lead. Tech, to this point, has missed only one shot, whereas Arkansas has made only one. If the aforementioned games are any lesson, expect a Razorback run to get back into the game.
Update: Arkansas never got closer than eight, with Texas Tech then pulling away to win by 15.
Last night alone in the NBA, there were at least four games that followed the above storyline:
Phoenix built a 47-22 lead over Golden State in the second quarter, only to see the Warriors rebound for an 80-72 lead (a 33-point turnaround from -25 to +8 on Golden State's part). Unfazed by blowing their huge lead, however, the Suns came back to win the game, their 13th straight victory.
Philly shaved a 17-point Dallas lead to just 3, although the Mavs pulled away again. It was the Sixers' 10th straight loss; Dallas had a 12-game winning streak earlier this season.
Sacramento erased a 16-point deficit to edge Utah.
Finally, in the late West Coast game, the Lakers came back from 21 behind to beat the Rockets.
A week ago, the Nets darted out to an 18-0 lead, but fell to Boston.
This recent lead-blowing even appears to transcend any particular sport. In NHL action last Monday, Washington squandered a 4-0 lead in falling to Pittsburgh 5-4.
The above scenarios were all that I planned to write about. But right now, upon checking the score of the Texas Tech-Arkansas men's basketball game, I see where the Red Raiders have jumped out to an 18-3 lead. Tech, to this point, has missed only one shot, whereas Arkansas has made only one. If the aforementioned games are any lesson, expect a Razorback run to get back into the game.
Update: Arkansas never got closer than eight, with Texas Tech then pulling away to win by 15.
Wednesday, December 13, 2006
Time to check in again on the three-point shooting of the Texas Tech men's basketball team. As noted in my November 30 posting (see below or in November 2006 archives), the Red Raiders were leading the nation in shooting percentage behind the arc, at 50.4. Citing the statistical concepts of extremity of outcomes in small sample sizes and regression to the mean, I predicted the team would drop off some.
It should also be noted that, over the past five seasons, none of the teams that led the nation in three-point percentage exceeded 44%.
2002 Oregon 42.4
2003 Illinois St. 44.0
2004 Birm. Southern 43.0
2005 Oklahoma St. 42.1
2006 Southern Utah 42.9
Since my last posting on this topic, Texas Tech has experienced a small drop in its accuracy from long distance, sitting currently in second place nationally at 47.8.
In the Red Raiders' three most recent games (season log), they had two poor outings from three-point land (4-14, .286 vs. Stanford, and 2-10, .200 vs. Louisiana Tech), followed by an 11-18 (.611) explosion vs. Centenary. I was at the Centenary game and noticed some fans marking each of Texas Tech's made treys by unveiling a succession of cloth signs with 3's on them. With the help of my faculty colleague Bo Cleveland (with later technical assistance by Rachna Mutreja), we were able to take the following photo of the display in full glory at game's end.

I'll continue to track the story. It's important to state that, even if Texas Tech's three-point percentage continues to drop -- as I predict it will -- the team could still lead the nation, as other teams will likely drop too. In other words, Texas Tech's anticipated drop would be in absolute terms, but not necessarily in relative terms.
In terms of individual players, BYU's Austin (Got the Range) Ainge is now down from his earlier 70.6 three-point percentage (which I cited in my previous write-up) to 54.2.
It should also be noted that, over the past five seasons, none of the teams that led the nation in three-point percentage exceeded 44%.
2002 Oregon 42.4
2003 Illinois St. 44.0
2004 Birm. Southern 43.0
2005 Oklahoma St. 42.1
2006 Southern Utah 42.9
Since my last posting on this topic, Texas Tech has experienced a small drop in its accuracy from long distance, sitting currently in second place nationally at 47.8.
In the Red Raiders' three most recent games (season log), they had two poor outings from three-point land (4-14, .286 vs. Stanford, and 2-10, .200 vs. Louisiana Tech), followed by an 11-18 (.611) explosion vs. Centenary. I was at the Centenary game and noticed some fans marking each of Texas Tech's made treys by unveiling a succession of cloth signs with 3's on them. With the help of my faculty colleague Bo Cleveland (with later technical assistance by Rachna Mutreja), we were able to take the following photo of the display in full glory at game's end.

I'll continue to track the story. It's important to state that, even if Texas Tech's three-point percentage continues to drop -- as I predict it will -- the team could still lead the nation, as other teams will likely drop too. In other words, Texas Tech's anticipated drop would be in absolute terms, but not necessarily in relative terms.
In terms of individual players, BYU's Austin (Got the Range) Ainge is now down from his earlier 70.6 three-point percentage (which I cited in my previous write-up) to 54.2.
Sunday, December 03, 2006
It was just a few days ago (see November 30 posting below) that I talked about how extreme patterns can occur when looking at a small number of observations (e.g., several batters hitting above .400 early in the baseball season). But, I warned, it's hard to maintain extremely high (or low) levels of performance over larger numbers of attempts.
Yesterday, however, a Division III men's basketball player did as much as can be done within a single game to contradict my assertions. What happened was that Lincoln University's Sami Wylie shot 51% on three-pointers.
If a player were to have shot (roughly) 50% on 10 three-point attempts, I would find that moderately interesting. In 20 attempts? More impressive. And so on as the number of shots from behind the arc increased.
Well, in Wylie's case, he shot 51% on 41 attempts from three-point land. Yes, he shot 41 times from downtown, making 21 treys! All told, he ended up with 69 points in Lincoln's 201-78 win over Ohio State-Marion.
ESPN.com's article likens the game to a scene from the movie Pleasantville, where "every shot from every conceivable angle goes in."
Yesterday, however, a Division III men's basketball player did as much as can be done within a single game to contradict my assertions. What happened was that Lincoln University's Sami Wylie shot 51% on three-pointers.
If a player were to have shot (roughly) 50% on 10 three-point attempts, I would find that moderately interesting. In 20 attempts? More impressive. And so on as the number of shots from behind the arc increased.
Well, in Wylie's case, he shot 51% on 41 attempts from three-point land. Yes, he shot 41 times from downtown, making 21 treys! All told, he ended up with 69 points in Lincoln's 201-78 win over Ohio State-Marion.
ESPN.com's article likens the game to a scene from the movie Pleasantville, where "every shot from every conceivable angle goes in."
Saturday, December 02, 2006
First, a disclosure: I received my undergraduate degree at UCLA, in 1984.
Going into this year's annual USC-UCLA football game, played earlier today, the rivalry over the past 15 years had been as streaky as is possible for a situation where both teams had enjoyed stretches of dominance.
1991 UCLA
1992 UCLA
1993 UCLA
1994 UCLA
1995 UCLA
1996 UCLA
1997 UCLA
1998 UCLA
1999 USC
2000 USC
2001 USC
2002 USC
2003 USC
2004 USC
2005 USC
With UCLA's eight straight wins, followed by USC's seven, we don't need a statistical test to tell us that the number of observed runs (uninterrupted streaks by one team) is the minimum possible -- two -- given that each team has won at least once.
USC was widely expected to beat UCLA today en route to the (mythical) national championship game, in the process tying UCLA's earlier eight-game winning streak in the Battle of Los Angeles.
But it wasn't to be. UCLA 13, USC 9.
Going into this year's annual USC-UCLA football game, played earlier today, the rivalry over the past 15 years had been as streaky as is possible for a situation where both teams had enjoyed stretches of dominance.
1991 UCLA
1992 UCLA
1993 UCLA
1994 UCLA
1995 UCLA
1996 UCLA
1997 UCLA
1998 UCLA
1999 USC
2000 USC
2001 USC
2002 USC
2003 USC
2004 USC
2005 USC
With UCLA's eight straight wins, followed by USC's seven, we don't need a statistical test to tell us that the number of observed runs (uninterrupted streaks by one team) is the minimum possible -- two -- given that each team has won at least once.
USC was widely expected to beat UCLA today en route to the (mythical) national championship game, in the process tying UCLA's earlier eight-game winning streak in the Battle of Los Angeles.
But it wasn't to be. UCLA 13, USC 9.
Thursday, November 30, 2006
Being a faculty member at Texas Tech University, I periodically check out the Internet discussion boards related to the school's sports teams. It was there that I learned a few hours ago that the Red Raider men's basketball team is, at the moment, leading the NCAA in three-point shooting percentage.
Texas Tech has made 58 of 115 attempts from behind the arc (50.4%). While I was looking at the team statistics, I decided to peruse the individual three-point shooting statistics, as well.
Excluding three players who are each 2-for-2 (100%) on three-pointers due to insufficient attempts, the current national leader among individuals is BYU's Austin Ainge, who's hit 12-17 (70.6%). (For those who are wondering, Austin is indeed the son of former NBA guard Danny.) I guess you can say the young Ainge has the range!
Neither Texas Tech's 50% success rate as a team, nor Ainge's 70% rate, is likely to hold up for the season. Last year's three-point percentage leaders at the end of the season were Southern Utah (team) at 42.9% and Northern Arizona's Stephen Sir (individual) at 48.9%.
The current season is about one-fourth of the way through. What we're likely seeing, therefore, is the extremity of results associated with small numbers of observations. This concept was first brought to my attention by Geoff Fong in the spring of 1984, when he was on the faculty at Northwestern and I was visiting during my tour of prospective graduate schools (I ultimately chose Michigan).
Geoff was telling me about his research on statistical reasoning, and he pointed out how, early in every Major League Baseball season, the list of batting leaders will tend to have several players hitting above .400, yet there would be virtually no chance of any player ending the season at that level (the last player to hit .400 or better for a season was, of course, Ted Williams in 1941).
This statistical document describes the small-numbers phenomenon a bit more technically:
...all other things being equal, variation is more pronounced with small samples than with large ones. The larger your sample, the more stable your results will be. They will be less subject to the possibility that another study would produce greatly different results. A corollary is that large samples are less likely to produce extreme results. For example, assuming that you have a fair coin, it's much more difficult to get all heads when you toss a coin 50 times than when you toss it only two or three times.
Let's use last year's Texas Tech three-point success rate of .390 as a baseline for this year's squad (though there has been some change in personnel, most of the Red Raiders' outside shooters are still on the team, including offensive stalwart Jarrius [Jay] Jackson).
Using an online calculator for what is known as a binomial probability, we can ask how likely it is that a .390 three-point shooting team (which is what this year's Red Raiders are assumed to be, based on last year) could make 58 (or more) treys in 115 attempts. The answer is .008, a little less than 1-in-100, so what the Red Raiders are doing is already very rare statistically. Eventually, we may have to reject our "null hypothesis" that Texas Tech really has an underlying .390 probability on making threes.
As noted above, however, the larger the sample, the less susceptibility to unusually high or low success rates. To approximate a full season's worth of shots (i.e., a larger sample) instead of just a quarter season, I multiplied by four, Texas Tech's current number of made threes (58 X 4 = 232) and number of attempts (115 X 4 = 460). The ratio of 232/460 is the same as the Raiders' current three-point percentage of 50.4, but would be a much longer-term accomplishment. Again, using .390 as a baseline, the team's probability of hitting 50.4% of 460 three-point attempts is much tinier than before, .0000004, about 4 in 10 million.
Another potentially relevant concept that I'd like to mention briefly is regression toward the mean, which Lady Raider basketball announcer Ryan Hyatt sometimes invokes in his radio broadcasts. Regression toward the mean simply refers to the tendency for extreme values in the early rounds of performance -- either extremely high or extremely low -- to be followed by values more in the center of the distribution.
In conclusion, the statistical phenomena of small samples and regression toward the mean both suggest that the Texas Tech men will suffer some drop-off from their current 50.4% three-point shooting percentage. You probably don't need to have a statistics teacher tell you a 50% three-point shooting clip is unlikely to be maintained for a full season, any more than you need one to tell you that baseball players batting over .400 for the first month of the season will almost certainly fall off in their averages. If, however, you have some interest in the statistical concepts associated with teams' and players' fall-off after hot starts, you've visited the right place!
Texas Tech has made 58 of 115 attempts from behind the arc (50.4%). While I was looking at the team statistics, I decided to peruse the individual three-point shooting statistics, as well.
Excluding three players who are each 2-for-2 (100%) on three-pointers due to insufficient attempts, the current national leader among individuals is BYU's Austin Ainge, who's hit 12-17 (70.6%). (For those who are wondering, Austin is indeed the son of former NBA guard Danny.) I guess you can say the young Ainge has the range!
Neither Texas Tech's 50% success rate as a team, nor Ainge's 70% rate, is likely to hold up for the season. Last year's three-point percentage leaders at the end of the season were Southern Utah (team) at 42.9% and Northern Arizona's Stephen Sir (individual) at 48.9%.
The current season is about one-fourth of the way through. What we're likely seeing, therefore, is the extremity of results associated with small numbers of observations. This concept was first brought to my attention by Geoff Fong in the spring of 1984, when he was on the faculty at Northwestern and I was visiting during my tour of prospective graduate schools (I ultimately chose Michigan).
Geoff was telling me about his research on statistical reasoning, and he pointed out how, early in every Major League Baseball season, the list of batting leaders will tend to have several players hitting above .400, yet there would be virtually no chance of any player ending the season at that level (the last player to hit .400 or better for a season was, of course, Ted Williams in 1941).
This statistical document describes the small-numbers phenomenon a bit more technically:
...all other things being equal, variation is more pronounced with small samples than with large ones. The larger your sample, the more stable your results will be. They will be less subject to the possibility that another study would produce greatly different results. A corollary is that large samples are less likely to produce extreme results. For example, assuming that you have a fair coin, it's much more difficult to get all heads when you toss a coin 50 times than when you toss it only two or three times.
Let's use last year's Texas Tech three-point success rate of .390 as a baseline for this year's squad (though there has been some change in personnel, most of the Red Raiders' outside shooters are still on the team, including offensive stalwart Jarrius [Jay] Jackson).
Using an online calculator for what is known as a binomial probability, we can ask how likely it is that a .390 three-point shooting team (which is what this year's Red Raiders are assumed to be, based on last year) could make 58 (or more) treys in 115 attempts. The answer is .008, a little less than 1-in-100, so what the Red Raiders are doing is already very rare statistically. Eventually, we may have to reject our "null hypothesis" that Texas Tech really has an underlying .390 probability on making threes.
As noted above, however, the larger the sample, the less susceptibility to unusually high or low success rates. To approximate a full season's worth of shots (i.e., a larger sample) instead of just a quarter season, I multiplied by four, Texas Tech's current number of made threes (58 X 4 = 232) and number of attempts (115 X 4 = 460). The ratio of 232/460 is the same as the Raiders' current three-point percentage of 50.4, but would be a much longer-term accomplishment. Again, using .390 as a baseline, the team's probability of hitting 50.4% of 460 three-point attempts is much tinier than before, .0000004, about 4 in 10 million.
Another potentially relevant concept that I'd like to mention briefly is regression toward the mean, which Lady Raider basketball announcer Ryan Hyatt sometimes invokes in his radio broadcasts. Regression toward the mean simply refers to the tendency for extreme values in the early rounds of performance -- either extremely high or extremely low -- to be followed by values more in the center of the distribution.
In conclusion, the statistical phenomena of small samples and regression toward the mean both suggest that the Texas Tech men will suffer some drop-off from their current 50.4% three-point shooting percentage. You probably don't need to have a statistics teacher tell you a 50% three-point shooting clip is unlikely to be maintained for a full season, any more than you need one to tell you that baseball players batting over .400 for the first month of the season will almost certainly fall off in their averages. If, however, you have some interest in the statistical concepts associated with teams' and players' fall-off after hot starts, you've visited the right place!
Saturday, November 25, 2006
In about a half-hour, the Utah Jazz will attempt to improve upon its 12-1 start to the current NBA season (game-by-game log; ignore the pre-season games that are listed first). The Jazz finished exactly at .500 last year (41-41), so such a torrid start this season comes as a surprise to most observers. This article provides some ideas of why Utah appears to be so improved.
Thursday, November 23, 2006
Happy Thanksgiving!
There was a men's college basketball game televised earlier today, in which Southern Illinois went scoreless in overtime in losing to Arkansas. Going scoreless in OT seems like an interesting type of cold hand.
Going scoreless for a five-minute stretch at any point in a game is probably fairly unusual. Further, if a game goes to overtime, that would seem to suggest the teams are pretty evenly matched (at least on that day or night). Therefore, one team shouldn't be able to shut out the opponent by sheer intimidation, for example by continually pressing and stealing the ball.
Shot clocks range from giving teams 24 seconds per possession to shoot in the NBA to 35 seconds in men's NCAA play (women's college ball uses 30 seconds, whereas the WNBA switched last season to 24 seconds from 30). Thus, unless both teams exhaust their full allotments of time to shoot, it would seem that teams could get about two possessions per minute, or 10 for an entire overtime. That's a lot of shots to miss (although a team could have fewer, due to turnovers), not to mention possible free throws.
One mechanism by which a team could go scoreless in OT -- of which you'll see some apparent evidence below -- is that it could get desperate after falling behind early in the extra period and then start jacking up threes.
I naturally wondered how often overtime shutouts have occurred. To get an estimate, I did some web searching using keywords such as overtime, scoreless, shut out and, to exclude other sports, basketball. It might not be the most scientific way to approach the problem, but it should provide a ballpark (or in this case, arena) figure. Below is a list of games I found from 2000 onward, complete with web links to game articles and box scores.
Men's College
Southern Illinois (vs. Arkansas), November 23, 2006
(SIU was 0-3 from the field in OT, no FT attempts)
George Mason (vs. James Madison), February 7, 2004
("The Patriots missed all six of their field goal tries, four from behind the arc, and went 0-for-2 at the free throw line in overtime.")
Women's College
Indiana (vs. Michigan State), February 29, 2004
(IU was 0-6 in OT field goal attempts, all from three-point land, no FT attempts)
Men's Pro
Boston (vs. Indiana), April 29, 2003
(first OT shutout in NBA play-off history; Celtics missed six shots from field and two FT attempts)
Vancouver (vs. Indiana), December 2, 2000
Women's Pro
None found.
There was a men's college basketball game televised earlier today, in which Southern Illinois went scoreless in overtime in losing to Arkansas. Going scoreless in OT seems like an interesting type of cold hand.
Going scoreless for a five-minute stretch at any point in a game is probably fairly unusual. Further, if a game goes to overtime, that would seem to suggest the teams are pretty evenly matched (at least on that day or night). Therefore, one team shouldn't be able to shut out the opponent by sheer intimidation, for example by continually pressing and stealing the ball.
Shot clocks range from giving teams 24 seconds per possession to shoot in the NBA to 35 seconds in men's NCAA play (women's college ball uses 30 seconds, whereas the WNBA switched last season to 24 seconds from 30). Thus, unless both teams exhaust their full allotments of time to shoot, it would seem that teams could get about two possessions per minute, or 10 for an entire overtime. That's a lot of shots to miss (although a team could have fewer, due to turnovers), not to mention possible free throws.
One mechanism by which a team could go scoreless in OT -- of which you'll see some apparent evidence below -- is that it could get desperate after falling behind early in the extra period and then start jacking up threes.
I naturally wondered how often overtime shutouts have occurred. To get an estimate, I did some web searching using keywords such as overtime, scoreless, shut out and, to exclude other sports, basketball. It might not be the most scientific way to approach the problem, but it should provide a ballpark (or in this case, arena) figure. Below is a list of games I found from 2000 onward, complete with web links to game articles and box scores.
Men's College
Southern Illinois (vs. Arkansas), November 23, 2006
(SIU was 0-3 from the field in OT, no FT attempts)
George Mason (vs. James Madison), February 7, 2004
("The Patriots missed all six of their field goal tries, four from behind the arc, and went 0-for-2 at the free throw line in overtime.")
Women's College
Indiana (vs. Michigan State), February 29, 2004
(IU was 0-6 in OT field goal attempts, all from three-point land, no FT attempts)
Men's Pro
Boston (vs. Indiana), April 29, 2003
(first OT shutout in NBA play-off history; Celtics missed six shots from field and two FT attempts)
Vancouver (vs. Indiana), December 2, 2000
Women's Pro
None found.
Monday, November 13, 2006
With yesterday's 17-16 win over the Buffalo Bills, the Indianapolis Colts have gotten off to a 9-0 start this season. This makes them the only team in NFL history to start out 9-0 in two consecutive seasons. Last year, in fact, the Colts won their first 13 games of the season.
Obviously, winning regular-season games is not the problem for Indy - it's getting to the Super Bowl. We'll see if things are any better this season, come play-off time.
Obviously, winning regular-season games is not the problem for Indy - it's getting to the Super Bowl. We'll see if things are any better this season, come play-off time.
Friday, November 10, 2006
Some players in a given sport seem to perform at the same level night after night, whereas others show more variability from good to bad in how they do. Is it more advantageous to have one of type of player than the other? Sal Baxamusa investigates this question with regard to selected MLB starting pitchers, in The Hardball Times.
Saturday, October 28, 2006
The Buffalo Sabres lost tonight to the Atlanta Thrashers, 5-4 in an overtime shoot-out. The loss, Buffalo's first of the season, means the Sabres must share the spot in the NHL record book with the 1993-94 Toronto Maple Leafs for best start to a season, at 10-0.
Friday, October 27, 2006
The 2006 World Series has just ended -- literally minutes ago -- with the St. Louis Cardinals closing out the Detroit Tigers in five games. Some notes from the perspective of streakiness:
Detroit pitcher Kenny Rogers, who was scheduled to go in a potential Game Six, will now have to wait for another year (and at age 41, he may not have many left in the game) to see if he can extend his current streak of 23 consecutive post-season scoreless innings. As shown in an ESPN graphic a few nights ago, these shut-out innings were compiled in three starts, one in each round of this year's play-offs: 7 and 2/3 against the Yankees, 7 and 1/3 against the A's, and 8 in the Tigers' lone win against the Cardinals. As shown in this article, the streak Rogers put together this post-season ranks among the best of all time. Should Detroit (or any other team Rogers pitches for) make the play-offs next season, all eyes will be on Rogers's throwing hand -- I mean, streak.
The Cards' David Eckstein, who got only two hits in his first 22 at-bats of this post-season, went 8-for-13 in the final three games against Detroit, en route to winning the World Series MVP award. For the Tigers, it was Sean Casey who had the hot bat.
Lastly, three stretches illustrate the apparent limitations of momentum. Both St. Louis and Detroit, of course, ended the regular season in slumps, yet made the World Series (see two articles in the links section on the right, addressing the issue of carryover from the end of the regular season to the play-offs). Also, the Tigers came into the World Series on a seven-game winning streak (three over the Yankees, four over the A's), yet took only one game from the Cards. It's not just that the Tigers lost the Fall Classic; numerous crucial fielding errors showed they were not at the top of their game against St. Louis.
Detroit pitcher Kenny Rogers, who was scheduled to go in a potential Game Six, will now have to wait for another year (and at age 41, he may not have many left in the game) to see if he can extend his current streak of 23 consecutive post-season scoreless innings. As shown in an ESPN graphic a few nights ago, these shut-out innings were compiled in three starts, one in each round of this year's play-offs: 7 and 2/3 against the Yankees, 7 and 1/3 against the A's, and 8 in the Tigers' lone win against the Cardinals. As shown in this article, the streak Rogers put together this post-season ranks among the best of all time. Should Detroit (or any other team Rogers pitches for) make the play-offs next season, all eyes will be on Rogers's throwing hand -- I mean, streak.
The Cards' David Eckstein, who got only two hits in his first 22 at-bats of this post-season, went 8-for-13 in the final three games against Detroit, en route to winning the World Series MVP award. For the Tigers, it was Sean Casey who had the hot bat.
Lastly, three stretches illustrate the apparent limitations of momentum. Both St. Louis and Detroit, of course, ended the regular season in slumps, yet made the World Series (see two articles in the links section on the right, addressing the issue of carryover from the end of the regular season to the play-offs). Also, the Tigers came into the World Series on a seven-game winning streak (three over the Yankees, four over the A's), yet took only one game from the Cards. It's not just that the Tigers lost the Fall Classic; numerous crucial fielding errors showed they were not at the top of their game against St. Louis.
Thursday, October 26, 2006
Buffalo won again tonight in NHL action (3-0 over the New York Islanders), giving the Sabres a perfect 10-0 ledger. Buffalo's hot start ties the league record for most wins to begin the season.
Saturday, October 21, 2006
Just one of those streaky days...
Michigan State took a 3-0 lead over Northwestern in their Big 10 football match-up, then fell behind 38-3 as the Wildcats scored 38 consecutive points. The Spartans then answered with 38 straight of their own, to win 41-38. In doing so, MSU set a new NCAA Division I-A record for size of deficit overcome to win (35 points).
If you look at the lists of the teams' drives (underneath the graphical diagram of scoring drives), you can see vividly what has to happen to produce a comeback like this -- one team gets amazingly hot and the other, similarly cold.
Prior to starting its comeback, Michigan State's last five possessions (excluding a brief one at the end of the first half) had consisted exclusively of punts and turnovers -- hardly a sign that the Spartans could put together four sustained touchdown drives (the other points came on a punt return TD and a field goal).
For Northwestern, the pattern was just the opposite. The Wildcats went from being able to move the ball up and down the field with apparent ease (at least that's what's implied by five touchdown drives) to their own stretch of entirely punts and turnovers -- including three straight "three and outs."
***
The Buffalo Sabres have opened up the National Hockey League season with a perfect 8-0 record, with tonight's win over the Boston Bruins. The Sabres are now two more wins away from tying the NHL record for most consecutive wins to start a season.
***
Finally, in tonight's World Series opener, won by St. Louis 7-2, Cardinal rookie Anthony Reyes retired 17 straight Tigers (i.e., nearly six straight innings of perfect baseball) after giving up a first-inning run. A graphic on the television broadcast noted that Reyes's streak was the best in World Series play since 1990, when Cincinnati's Jose Rijo put down 20 straight Oakland battersin the Reds' series-clinching Game 4 victory (see little game-by-game summaries on the right-hand side of the linked document).
Michigan State took a 3-0 lead over Northwestern in their Big 10 football match-up, then fell behind 38-3 as the Wildcats scored 38 consecutive points. The Spartans then answered with 38 straight of their own, to win 41-38. In doing so, MSU set a new NCAA Division I-A record for size of deficit overcome to win (35 points).
If you look at the lists of the teams' drives (underneath the graphical diagram of scoring drives), you can see vividly what has to happen to produce a comeback like this -- one team gets amazingly hot and the other, similarly cold.
Prior to starting its comeback, Michigan State's last five possessions (excluding a brief one at the end of the first half) had consisted exclusively of punts and turnovers -- hardly a sign that the Spartans could put together four sustained touchdown drives (the other points came on a punt return TD and a field goal).
For Northwestern, the pattern was just the opposite. The Wildcats went from being able to move the ball up and down the field with apparent ease (at least that's what's implied by five touchdown drives) to their own stretch of entirely punts and turnovers -- including three straight "three and outs."
***
The Buffalo Sabres have opened up the National Hockey League season with a perfect 8-0 record, with tonight's win over the Boston Bruins. The Sabres are now two more wins away from tying the NHL record for most consecutive wins to start a season.
***
Finally, in tonight's World Series opener, won by St. Louis 7-2, Cardinal rookie Anthony Reyes retired 17 straight Tigers (i.e., nearly six straight innings of perfect baseball) after giving up a first-inning run. A graphic on the television broadcast noted that Reyes's streak was the best in World Series play since 1990, when Cincinnati's Jose Rijo put down 20 straight Oakland battersin the Reds' series-clinching Game 4 victory (see little game-by-game summaries on the right-hand side of the linked document).
Friday, October 20, 2006
I don't believe I've ever before drawn a hot-hand example from the Canadian Football League. Thanks to Phil Birnbaum's blog, however, there's always a first time.
Sunday, October 08, 2006
Despite a nearly $200 million payroll and virtual all-star team for their starting line-up, the New York Yankees have once again stumbled in the play-offs, losing three games to one to the Detroit Tigers in the first round. The Yanks have not won the World Series since 2000.
I think many would agree that the team's breakdown occurred in two areas -- an aging and injury-prone starting pitching rotation and some shockingly poor hitting by a number of players who are typically very productive with the bat; the latter problem is discussed in this article.
The list below compares selected Yankees' 2006 regular-season batting averages (in parentheses) to their batting performances in the Detroit Series:
Robinson Cano (.342) 2-for-15
Gary Sheffield (.298) 1-for-12
Alex Rodriguez (.290) 1-for-14
Jason Giambi (.253) 1-for-8
Using an online binomial calculator, one can estimate the probability for each player of his getting as many hits (or fewer) as he did in the Detroit series purely by chance, given his (much higher) regular-season baseline batting average. Such probabilities are indeed low: Cano, .07; Sheffield, .09; Rodriguez, .06; and Giambi, .36. To reject a chance explanation, however, we typically require a probability of .05 or smaller (also known as "statistical significance").
For ARod, this latest poor performance in the postseason is nothing new. As the above-linked article notes, "Dating back to Game 4 of the 2004 American League Championship Series, Rodriguez has five hits in his last 46 postseason at-bats."
Here are some additional statistical observations from the baseball play-offs, by Elias Sports Bureau.
I think many would agree that the team's breakdown occurred in two areas -- an aging and injury-prone starting pitching rotation and some shockingly poor hitting by a number of players who are typically very productive with the bat; the latter problem is discussed in this article.
The list below compares selected Yankees' 2006 regular-season batting averages (in parentheses) to their batting performances in the Detroit Series:
Robinson Cano (.342) 2-for-15
Gary Sheffield (.298) 1-for-12
Alex Rodriguez (.290) 1-for-14
Jason Giambi (.253) 1-for-8
Using an online binomial calculator, one can estimate the probability for each player of his getting as many hits (or fewer) as he did in the Detroit series purely by chance, given his (much higher) regular-season baseline batting average. Such probabilities are indeed low: Cano, .07; Sheffield, .09; Rodriguez, .06; and Giambi, .36. To reject a chance explanation, however, we typically require a probability of .05 or smaller (also known as "statistical significance").
For ARod, this latest poor performance in the postseason is nothing new. As the above-linked article notes, "Dating back to Game 4 of the 2004 American League Championship Series, Rodriguez has five hits in his last 46 postseason at-bats."
Here are some additional statistical observations from the baseball play-offs, by Elias Sports Bureau.
Friday, September 29, 2006
The St. Louis Cardinals' 8 1/2 game lead over the Houston Astros in the National League Central with only 12 games left (after the close of play on September 19) has almost completely evaporated. The Cards' lead now is only 1/2 game, with the final weekend of play remaining -- Houston at Atlanta, and St. Louis hosting Milwaukee (game-by-game logs for the Astros and Cards).
Presumably in connection with this dramatic turnaround, CNN/SI has posted its list of the greatest Pennant Race Collapses of all-time. To refer to these occurrences purely as "collapses" tells only half the story, in my view. In many (if not most) cases, one team's collapse was accompanied by another team's getting extremely hot. In some instances, the team making the comeback only won the pennant (league or divisional) by a single game at the end or in a special play-off after the seasonal standings ended in a tie. Thus, both the collapse by one team and the hot streak by the other were necessary for the latter to win out.
From CNN/SI's list, for example, the No. 2 entry involved the following from 1993: "On July 22, the Giants led Atlanta by 10 games. The Braves went 49-16 down the stretch to win the NL West by one game..."
And the No. 8 entry, the famous 1951 showdown between the Brooklyn Dodgers and New York Giants had this storyline: "On Aug. 11, the Dodgers led the Giants by 13 1/2 games, but the Giants won 16 in a row at one point and went 37-7 overall before winning a three-game playoff, which culminated in Bobby Thomson's Shot Heard 'Round the World."
In 2004, on the previous incarnation of the Hot Hand website, I did a fairly extensive analysis to mark the 35th anniversary of the 1969 NL East race, in which the New York Mets overtook the Chicago Cubs (this write-up is no longer posted here, but is available from me upon request). The following graph shows that, once again, both a hot streak by one team and a cold one by the other were implicated. The Mets ultimately won the division by eight games, so in this instance, they could have gotten by with a bit less torrid of a winning stretch.
Will this year's Cardinals join the ignominious list of teams that squandered big leads and perhaps earn a special "honor" for doing it so late in the season? Stay tuned this weekend!
Presumably in connection with this dramatic turnaround, CNN/SI has posted its list of the greatest Pennant Race Collapses of all-time. To refer to these occurrences purely as "collapses" tells only half the story, in my view. In many (if not most) cases, one team's collapse was accompanied by another team's getting extremely hot. In some instances, the team making the comeback only won the pennant (league or divisional) by a single game at the end or in a special play-off after the seasonal standings ended in a tie. Thus, both the collapse by one team and the hot streak by the other were necessary for the latter to win out.
From CNN/SI's list, for example, the No. 2 entry involved the following from 1993: "On July 22, the Giants led Atlanta by 10 games. The Braves went 49-16 down the stretch to win the NL West by one game..."
And the No. 8 entry, the famous 1951 showdown between the Brooklyn Dodgers and New York Giants had this storyline: "On Aug. 11, the Dodgers led the Giants by 13 1/2 games, but the Giants won 16 in a row at one point and went 37-7 overall before winning a three-game playoff, which culminated in Bobby Thomson's Shot Heard 'Round the World."
In 2004, on the previous incarnation of the Hot Hand website, I did a fairly extensive analysis to mark the 35th anniversary of the 1969 NL East race, in which the New York Mets overtook the Chicago Cubs (this write-up is no longer posted here, but is available from me upon request). The following graph shows that, once again, both a hot streak by one team and a cold one by the other were implicated. The Mets ultimately won the division by eight games, so in this instance, they could have gotten by with a bit less torrid of a winning stretch.
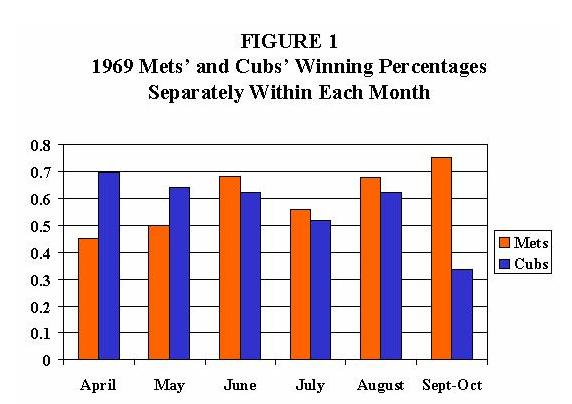
Will this year's Cardinals join the ignominious list of teams that squandered big leads and perhaps earn a special "honor" for doing it so late in the season? Stay tuned this weekend!
Tuesday, September 26, 2006
Byron Nelson, one of the all-time great golfers, died today at age 94. Among Nelson's many accomplishments was his record streak of winning 11 straight tournaments, which he did in 1945.
Tiger Woods is currently on his own streak, having won the last five tournaments he's played. In the above-linked article on Nelson's passing, Woods is quoted as follows:
"In this day and age, with this competition, to win 11 in a row would be almost unheard of," Woods said after his fifth straight victory when asked how Nelson's accomplishment compared with others, like Joe DiMaggio's 56-game hitting streak.
"What Byron accomplished, that goes down as one of the great years in the history of our sport. ... DiMaggio's record, I see that being broken more than winning 11 in a row."
Tiger Woods is currently on his own streak, having won the last five tournaments he's played. In the above-linked article on Nelson's passing, Woods is quoted as follows:
"In this day and age, with this competition, to win 11 in a row would be almost unheard of," Woods said after his fifth straight victory when asked how Nelson's accomplishment compared with others, like Joe DiMaggio's 56-game hitting streak.
"What Byron accomplished, that goes down as one of the great years in the history of our sport. ... DiMaggio's record, I see that being broken more than winning 11 in a row."
Monday, September 25, 2006
In yesterday's pro football action, Washington quarterback Mark Brunell set a new NFL record with 22 straight pass completions. In looking over the play-by-play sheet (which can be accessed from the linked article), it appeared that many of Brunell's completions were short passes. Ultimately, however, a record is a record, and no one else had ever completed 22 in a row.
Tuesday, September 19, 2006
I didn't think the 2006 L.A. Dodgers could give us streakologists anything more to work with, beyond what they've already done this season! This is the team that, of course, lost 13 of its first 14 games after the All-Star Break, then immediately won 17 of 18, then later settled into a pattern one observer called "Consistent Inconsistency."
However, last night's Dodger miracle really takes the cake! Opening up the bottom of the ninth trailing 9-5 to San Diego, L.A. tied the game in a most unusual way -- solo homers by four straight batters. This particular feat had not been accomplished by any major-league team since 1964! (At the college level, though, we saw a team hit five consecutive homers earlier this year.)
Then, after the Padres took a 10-9 lead in the top of the tenth, the Dodgers won on a two-run homer by Nomar Garciaparra (ESPN.com article, play-by-play sheet).
Magnifying the significance of L.A.'s ninth-inning homer barrage further still, beyond the pressure of it being the ninth inning, the Dodgers and Padres are battling to the wire in the final weeks of the season for the National League West title (San Diego had entered the game 1/2 game up on the Dodgers, but Monday night's win now gives L.A. a 1/2 game lead).
The Dodgers most certainly don't have a Murderers' Row. In fact, they currently rank 15th in home runs out of the 16 National League teams.
To estimate the probability of the Dodgers' home-run burst, I first looked at the four batters who went yard (with their season-long home-run count and total number of official at-bats, which I found earlier today, in parentheses). In the order they batted, they are:
Jeff Kent (14 HR in 371 AB, ratio = .04)
J.D. Drew (17 HR in 460 AB, ratio = .04)
Russell Martin (10 HR in 378 AB, ratio = .03)
Marlon Anderson (9 HR in 244 AB, ratio = .04)
The probability of these four Dodgers putting together a string of four consecutive homers is thus:
.04 X .04 X .03 X .04 = .000002, or 1 in 500,000.
This calculation assumes independence of at-bats, like coin flips. One might argue that, if the same pitcher faced all four batters, he may have engaged in "streak pitching" to the same easy-to-hit part of the strike zone. An independence assumption may not be fully defensible, but it should be noted that the Padres changed pitchers after the first two homers, with relief ace Trevor Hoffman coming in (to no avail). The participation of multiple pitchers, along with multiple hitters, would seem to increase the independence of the events.
Can the Dodgers possibly top this?
However, last night's Dodger miracle really takes the cake! Opening up the bottom of the ninth trailing 9-5 to San Diego, L.A. tied the game in a most unusual way -- solo homers by four straight batters. This particular feat had not been accomplished by any major-league team since 1964! (At the college level, though, we saw a team hit five consecutive homers earlier this year.)
Then, after the Padres took a 10-9 lead in the top of the tenth, the Dodgers won on a two-run homer by Nomar Garciaparra (ESPN.com article, play-by-play sheet).
Magnifying the significance of L.A.'s ninth-inning homer barrage further still, beyond the pressure of it being the ninth inning, the Dodgers and Padres are battling to the wire in the final weeks of the season for the National League West title (San Diego had entered the game 1/2 game up on the Dodgers, but Monday night's win now gives L.A. a 1/2 game lead).
The Dodgers most certainly don't have a Murderers' Row. In fact, they currently rank 15th in home runs out of the 16 National League teams.
To estimate the probability of the Dodgers' home-run burst, I first looked at the four batters who went yard (with their season-long home-run count and total number of official at-bats, which I found earlier today, in parentheses). In the order they batted, they are:
Jeff Kent (14 HR in 371 AB, ratio = .04)
J.D. Drew (17 HR in 460 AB, ratio = .04)
Russell Martin (10 HR in 378 AB, ratio = .03)
Marlon Anderson (9 HR in 244 AB, ratio = .04)
The probability of these four Dodgers putting together a string of four consecutive homers is thus:
.04 X .04 X .03 X .04 = .000002, or 1 in 500,000.
This calculation assumes independence of at-bats, like coin flips. One might argue that, if the same pitcher faced all four batters, he may have engaged in "streak pitching" to the same easy-to-hit part of the strike zone. An independence assumption may not be fully defensible, but it should be noted that the Padres changed pitchers after the first two homers, with relief ace Trevor Hoffman coming in (to no avail). The participation of multiple pitchers, along with multiple hitters, would seem to increase the independence of the events.
Can the Dodgers possibly top this?
Monday, September 18, 2006
Long Stretches of Alternating Wins and Losses
Some of you may recall a series of analyses I conducted back in January and February on the St. Louis University men's basketball team's remarkable pattern of alternating wins and losses for its first 19 games of the 2005-06 season (game-by-game log). In other words, the team won every odd-numbered game and lost every even-numbered game until it was 10-9 after 19 games. St. Louis then won its 20th game, which gave the team two straight wins, the first time two of its games had the same outcome.
Mathematically, I framed the problem as an "n choose k" question: If you had 19 little boxes lined up (one for each game) and 10 slips of paper with a "W" written on each (one for each win), where each box could hold either zero or one slip, in how many ways could you distribute the 10 slips into the 19 boxes? The answer, as obtained at this online "n choose k" calculator, was 92,378 different ways. This blurb mentions my analysis after SLU's first 17 games, at which point the team's alternation of a win, then a loss, then a win, etc., had roughly a 1-in-24,000 probability.
Frank Vaccaro has now looked into similar stretches in Major League Baseball history and he's also come up with a name for the phenomenon: Consistent Inconsistency. In an e-mail distributed to members of the Society for American Baseball Research's (SABR) listserve discussion forum, Vaccaro posted the following information (accurate as of the close of play on Friday, September 15, 2006):
You might notice that the Los Angeles Dodgers have been alternating wins and losses for the previous ten games. A loss tonight (very likely) will run their streak to eleven. [This indeed happened, then the Dodgers lost again, to end the alternation, as seen in their game-by-game log.] As I'm always on the lookout for regular-season predictors of post-season success, this caught my eye.
Consistent Inconsistency is not something that great, or even good teams, engage in... Other teams that engaged in long streaks of Consistent Inconsistency this year include Cincinnati, no surprise, 10 games, 6/19 to 6/29 and Atlanta, 10 games, 6/23 to 7/3. Toronto, already mentioned, would have also had a ten-game run of this stat had they lost yesterday -- but they won. This gave them two such streaks of nine games since mid-August.
Historically, there have been pennant winners who have had ten-game or more streaks of alternating wins and losses. Thirty-four teams, entering 2006, finished in first despite having alternating won-loss streaks of ten games or more, but this number jumps up as MLB adds divisions: 11 teams 1871-1968, 10 teams, 1969-1993, and 13 teams, 1994-2005...
Here are the number of occurences of these long streaks with only the most recent teams listed, entering 2006 (the date is the date of the start of the streak):
Streak--# of--
Length--Teams--Most recently accomplished by:
16--2--1981 LAn 6/7, 1974 PHIn 6/4.
15--3--1949 CHIn 8/16, 1913 CHIa 6/12, 1908 CHIa 4/28.
14--11--2005 COLn 9/17, 2001 MILn 8/22, 2000 CINn 6/20...
13--17--2000 FLAn 8/23, 2000 ANAa 8/18, 1992 OAKa 4/17...
12--29--2004 CHIa 8/24, 2003 HOUn 7/30, 2002 PITn 5/27...
11--77--2005 MILn 7/15, 2004 COLn 4/25, 2004 LAn 4/20...
10--118--2005 SEAa 8/28, 2005 LAn 5/2, 2004 PHIn 5/22...
257 STREAKS OF AT LEAST 10 G ALTERNATING WINS AND LOSSES
This makes the Dodgers the 249th team on the list. Eleven teams had two such streaks during their season.
Mathematically, I framed the problem as an "n choose k" question: If you had 19 little boxes lined up (one for each game) and 10 slips of paper with a "W" written on each (one for each win), where each box could hold either zero or one slip, in how many ways could you distribute the 10 slips into the 19 boxes? The answer, as obtained at this online "n choose k" calculator, was 92,378 different ways. This blurb mentions my analysis after SLU's first 17 games, at which point the team's alternation of a win, then a loss, then a win, etc., had roughly a 1-in-24,000 probability.
Frank Vaccaro has now looked into similar stretches in Major League Baseball history and he's also come up with a name for the phenomenon: Consistent Inconsistency. In an e-mail distributed to members of the Society for American Baseball Research's (SABR) listserve discussion forum, Vaccaro posted the following information (accurate as of the close of play on Friday, September 15, 2006):
You might notice that the Los Angeles Dodgers have been alternating wins and losses for the previous ten games. A loss tonight (very likely) will run their streak to eleven. [This indeed happened, then the Dodgers lost again, to end the alternation, as seen in their game-by-game log.] As I'm always on the lookout for regular-season predictors of post-season success, this caught my eye.
Consistent Inconsistency is not something that great, or even good teams, engage in... Other teams that engaged in long streaks of Consistent Inconsistency this year include Cincinnati, no surprise, 10 games, 6/19 to 6/29 and Atlanta, 10 games, 6/23 to 7/3. Toronto, already mentioned, would have also had a ten-game run of this stat had they lost yesterday -- but they won. This gave them two such streaks of nine games since mid-August.
Historically, there have been pennant winners who have had ten-game or more streaks of alternating wins and losses. Thirty-four teams, entering 2006, finished in first despite having alternating won-loss streaks of ten games or more, but this number jumps up as MLB adds divisions: 11 teams 1871-1968, 10 teams, 1969-1993, and 13 teams, 1994-2005...
Here are the number of occurences of these long streaks with only the most recent teams listed, entering 2006 (the date is the date of the start of the streak):
Streak--# of--
Length--Teams--Most recently accomplished by:
16--2--1981 LAn 6/7, 1974 PHIn 6/4.
15--3--1949 CHIn 8/16, 1913 CHIa 6/12, 1908 CHIa 4/28.
14--11--2005 COLn 9/17, 2001 MILn 8/22, 2000 CINn 6/20...
13--17--2000 FLAn 8/23, 2000 ANAa 8/18, 1992 OAKa 4/17...
12--29--2004 CHIa 8/24, 2003 HOUn 7/30, 2002 PITn 5/27...
11--77--2005 MILn 7/15, 2004 COLn 4/25, 2004 LAn 4/20...
10--118--2005 SEAa 8/28, 2005 LAn 5/2, 2004 PHIn 5/22...
257 STREAKS OF AT LEAST 10 G ALTERNATING WINS AND LOSSES
This makes the Dodgers the 249th team on the list. Eleven teams had two such streaks during their season.
Tuesday, September 05, 2006
Jelena Jankovic, a tennis player I'd never heard of prior to today, has reached the semi-finals of the U.S. Open women's singles bracket. As with golf, there are so many men's and women's tennis players out there that it's not unusual for someone I've never heard of to do extremely well in a major tournament.
What makes Jankovic's case unusual -- and interesting to me as an observer of streaks -- is that, in the early months of 2006, she lost 10 straight matches. Given tennis's single-elimination format, she thus went from city to city, getting eliminated each time after one match.
However Jankovic did it, she was able to turn things around, making the quarter-finals (final eight) or better in several later tournaments. I'll have to think about what kinds of analyses I could do. For now, though, her winning streak of five straight matches at the U.S. Open is something to behold.
What makes Jankovic's case unusual -- and interesting to me as an observer of streaks -- is that, in the early months of 2006, she lost 10 straight matches. Given tennis's single-elimination format, she thus went from city to city, getting eliminated each time after one match.
However Jankovic did it, she was able to turn things around, making the quarter-finals (final eight) or better in several later tournaments. I'll have to think about what kinds of analyses I could do. For now, though, her winning streak of five straight matches at the U.S. Open is something to behold.
Monday, September 04, 2006
My specialty on this blog is, of course, the statistical analysis of sports streakiness. It has not been my intention to exclude other, non-statistical perspectives on hotness and coldness; I just haven't seen much of other genres.
Now, however, I've just finished reading the book Confidence: How Winning Streaks & Losing Streaks Begin & End (excerpt), by Harvard Business School professor Rosabeth Moss Kanter. The original hardcover version came out in 2004, but the paperback, which I read, just came out this year. Focusing on the worlds of business and sports, the book examines long-term failures, successes, and turnarounds from one to the other, through the lens of organizational culture.
In the athletic realm, Kanter uses two women's collegiate teams, North Carolina soccer and UConn basketball, to present the most extensive case studies of winning cultures, the Prairie View A&M football squad to illustrate a losing culture, and the Philadelphia Eagles' ascension to Super Bowl-quality in recent years to demonstrate positive turnaround. Dusty Baker's Chicago Cubs, who at the time of the book's initial publication looked to be turning around the franchise's longstanding losing ways (although they're not doing so at present), are discussed more briefly, as are several other teams.
What I take to be Kanter's major points are as follows:
*An organization's most visible results -- on the scoreboard or in financial data -- will tend to be reflected at a deeper level by other markers, such as a leader's communicative skills and ability to innovate (and spur innovation) and a team's work ethic, quality of facilities, community support, etc.
*Winning -- or losing -- can launch "chain reactions," thus perpetuating the original trend. Winning gets a team on television, helps attract better players (either through free agency in the pros or recruiting at the college level), builds fan support, etc., which fosters further winning, brings in money to improve facilities, etc. Losing sets the opposite types of events in motion.
*The ideal psychological environment for an organization seems to be one in which employees know they'll be held accountable for maintaining productive output, but feel supported enough that they will be comfortable taking risks, innovating, and reaching out to colleagues in a collaborative spirit. Failure of a promising idea to bear fruit will not trigger a cycle of criticism and blame, but rather a coming together of employees to improve the next time.
These ideas certainly seem valid. The tricky part -- which Kanter readily acknowledges -- is in untangling the causality. Yes, a positive attitude (or nice facilities or fan support) can help a team win, but winning will also likely promote a positive attitude (and the ability to construct new facilities and to attract fans).
Implementing Kanter's suggestions could well spur a winning streak, but even if a team doesn't end up winning as much as it had hoped, the changes could still be a net positive. One example I've thought of is that a university that attempts to improve its national academic ranking by building a new libary, will still have a nice new library, regardless of what happens with the rankings. Ultimately, however, there are no guarantees. I suspect there are many sports teams Kanter did not talk about that work hard in practice, assess player performance via objective "metrics," have nice facilities -- and still lose.
Statistical hot-hand research, that is, whether outcomes of successive trials on sports tasks are independent or not, is discussed occasionally in the book -- including citation of the Gilovich et al. study and a reference to Duke men's basketball coach Mike Krzyzewski's philosophy that players should always focus on the "next play," without carrying over any reaction from the previous one (p. 351). Most of the book's subject matter deals with long-term trends, however, and not moment-to-moment performance.
At 380 pages, the book will require dedication from the reader. Many portions seemed redundant to me, and full of platitudes. Often, the text jumps from one team/organization to another. My favorite parts were the extended discussions of single case studies, such as Prairie View football, Continental Airlines, and Nelson Mandela's leadership in transforming South African society.
Now, however, I've just finished reading the book Confidence: How Winning Streaks & Losing Streaks Begin & End (excerpt), by Harvard Business School professor Rosabeth Moss Kanter. The original hardcover version came out in 2004, but the paperback, which I read, just came out this year. Focusing on the worlds of business and sports, the book examines long-term failures, successes, and turnarounds from one to the other, through the lens of organizational culture.
In the athletic realm, Kanter uses two women's collegiate teams, North Carolina soccer and UConn basketball, to present the most extensive case studies of winning cultures, the Prairie View A&M football squad to illustrate a losing culture, and the Philadelphia Eagles' ascension to Super Bowl-quality in recent years to demonstrate positive turnaround. Dusty Baker's Chicago Cubs, who at the time of the book's initial publication looked to be turning around the franchise's longstanding losing ways (although they're not doing so at present), are discussed more briefly, as are several other teams.
What I take to be Kanter's major points are as follows:
*An organization's most visible results -- on the scoreboard or in financial data -- will tend to be reflected at a deeper level by other markers, such as a leader's communicative skills and ability to innovate (and spur innovation) and a team's work ethic, quality of facilities, community support, etc.
*Winning -- or losing -- can launch "chain reactions," thus perpetuating the original trend. Winning gets a team on television, helps attract better players (either through free agency in the pros or recruiting at the college level), builds fan support, etc., which fosters further winning, brings in money to improve facilities, etc. Losing sets the opposite types of events in motion.
*The ideal psychological environment for an organization seems to be one in which employees know they'll be held accountable for maintaining productive output, but feel supported enough that they will be comfortable taking risks, innovating, and reaching out to colleagues in a collaborative spirit. Failure of a promising idea to bear fruit will not trigger a cycle of criticism and blame, but rather a coming together of employees to improve the next time.
These ideas certainly seem valid. The tricky part -- which Kanter readily acknowledges -- is in untangling the causality. Yes, a positive attitude (or nice facilities or fan support) can help a team win, but winning will also likely promote a positive attitude (and the ability to construct new facilities and to attract fans).
Implementing Kanter's suggestions could well spur a winning streak, but even if a team doesn't end up winning as much as it had hoped, the changes could still be a net positive. One example I've thought of is that a university that attempts to improve its national academic ranking by building a new libary, will still have a nice new library, regardless of what happens with the rankings. Ultimately, however, there are no guarantees. I suspect there are many sports teams Kanter did not talk about that work hard in practice, assess player performance via objective "metrics," have nice facilities -- and still lose.
Statistical hot-hand research, that is, whether outcomes of successive trials on sports tasks are independent or not, is discussed occasionally in the book -- including citation of the Gilovich et al. study and a reference to Duke men's basketball coach Mike Krzyzewski's philosophy that players should always focus on the "next play," without carrying over any reaction from the previous one (p. 351). Most of the book's subject matter deals with long-term trends, however, and not moment-to-moment performance.
At 380 pages, the book will require dedication from the reader. Many portions seemed redundant to me, and full of platitudes. Often, the text jumps from one team/organization to another. My favorite parts were the extended discussions of single case studies, such as Prairie View football, Continental Airlines, and Nelson Mandela's leadership in transforming South African society.
Wednesday, August 30, 2006
I wanted to tie a bow to wrap up three stories I had written about earlier this month:
With their 7-2 win over Boston this afternoon (and the day off tomorrow), the Oakland A's have completed their August games with a 21-6 record (game-by-game log). As I discussed originally in my August 8 posting, the A's have shown an amazing tendency to get hot in August, going back several years. From 2001-2006 inclusive, Oakland's record for games in August is 124-45 (.734)...
A couple of Sundays ago (August 20), I wrote about the Seattle Mariners' record 20-game losing streak within their own division, the American League West. In the time since, the M's have really turned things around (log). After August 20, Seattle went outside of the AL West, winning five out of six games (combined) against the AL East's New York Yankees and Boston Red Sox. These wins, of course, did nothing to end the Mariners' AL West losing streak, but seemed to suggest Seattle had righted the ship. The Mariners then returned to AL West play a couple nights ago, shutting out the Angels 2-0. And tonight, the M's go for a three-game sweep over the Halos...
The Houston Astros' Willy Taveras, about whom I wrote in the posting immediately below the current one, had his consecutive games hitting steak end at 30 on Tuesday night.
With their 7-2 win over Boston this afternoon (and the day off tomorrow), the Oakland A's have completed their August games with a 21-6 record (game-by-game log). As I discussed originally in my August 8 posting, the A's have shown an amazing tendency to get hot in August, going back several years. From 2001-2006 inclusive, Oakland's record for games in August is 124-45 (.734)...
A couple of Sundays ago (August 20), I wrote about the Seattle Mariners' record 20-game losing streak within their own division, the American League West. In the time since, the M's have really turned things around (log). After August 20, Seattle went outside of the AL West, winning five out of six games (combined) against the AL East's New York Yankees and Boston Red Sox. These wins, of course, did nothing to end the Mariners' AL West losing streak, but seemed to suggest Seattle had righted the ship. The Mariners then returned to AL West play a couple nights ago, shutting out the Angels 2-0. And tonight, the M's go for a three-game sweep over the Halos...
The Houston Astros' Willy Taveras, about whom I wrote in the posting immediately below the current one, had his consecutive games hitting steak end at 30 on Tuesday night.
Sunday, August 27, 2006
The Houston Astros' Willy Taveras has just extended his hitting streak to 30 games, beating out a dribbler toward third base in the first inning at Pittsburgh (I get most Astro and Texas Ranger games on cable TV in Lubbock, Texas, where I live).
The 30-game mark is when I'll generally start to write about hitting streaks. Thirty is a nice round number, and is a little over halfway to Joe DiMaggio's record of 56 games with at least one hit per contest.
It'll probably be several more games before I start presenting calculations of Taveras's probability of catching DiMaggio. To get a feel for the nature of these calculations, however, you can look at this write-up I did for the Phillies' Chase Utley, back when he had a nice streak going (which reached 35 games before ending).
The 30-game mark is when I'll generally start to write about hitting streaks. Thirty is a nice round number, and is a little over halfway to Joe DiMaggio's record of 56 games with at least one hit per contest.
It'll probably be several more games before I start presenting calculations of Taveras's probability of catching DiMaggio. To get a feel for the nature of these calculations, however, you can look at this write-up I did for the Phillies' Chase Utley, back when he had a nice streak going (which reached 35 games before ending).
Sunday, August 20, 2006
The Seattle Mariners have closed out the weekend losing their 20th straight American League Western Division game, 3-2 to the Angels. In terms of consecutive losses within a team's own division, the Mariners have comfortably surpassed two other teams (the 2004 Diamondbacks and 1993 Rockies) who each lost 16 straight divisional games. It was not until 1969 that Major League Baseball -- having expanded from 20 to 24 teams -- introduced Eastern and Western divisions within each league. Prior to that, all the American League teams competed in one set of standings, as did all the National League teams, with the two first-place finishers going directly to the World Series.
Wednesday, August 16, 2006
The L.A. Dodgers' amazing turnaround continues. The Dodgers started off the second half of the season, right after the All-Star Break, by losing 13 out of 14. They've now rebounded by winning 17 of 18 (second half game-by-game log).
Jon Weisman at Dodger Thoughts conveys the strangeness of it all in this essay, a brief excerpt of which follows:
Why does the best Dodger 18-game run in 107 years and best National League run in 20 years feel so unreal? ... A .533 team playing .944 ball after an .071 stretch is hard to wrap the brain around.
(I interpret "best National League run" to mean by any NL team, not the Dodgers' best run through the NL.)
On the SABR members' e-mail discussion forum, the Dodgers' recent streakiness prompted an inquiry into other abrupt turnarounds (thanks primarily to Bob Timmerman and Frank Vaccaro for their messages). Examining the longest win-only stretches followed immediately by the longest lose-only stretches (or vice-versa), the most common patterns involved stretches of around 8 or 9 games won (or lost) and then 8 or 9 lost (or won). The greatest total number of games listed, in which a team's sequence consisted only of a fairly long winning and losing streak, was 21: The 1927 Detroit Tigers won 13 straight, then lost the next 8, from August 10-31 of that year (log).
A dramatic example I recalled is that of the 1987 Milwaukee Brewers. The Brewers started off the season with 13 straight wins. The losing streak did not come immediately thereafter, but it wasn't long before they lost 12 straight (log).
Jon Weisman at Dodger Thoughts conveys the strangeness of it all in this essay, a brief excerpt of which follows:
Why does the best Dodger 18-game run in 107 years and best National League run in 20 years feel so unreal? ... A .533 team playing .944 ball after an .071 stretch is hard to wrap the brain around.
(I interpret "best National League run" to mean by any NL team, not the Dodgers' best run through the NL.)
On the SABR members' e-mail discussion forum, the Dodgers' recent streakiness prompted an inquiry into other abrupt turnarounds (thanks primarily to Bob Timmerman and Frank Vaccaro for their messages). Examining the longest win-only stretches followed immediately by the longest lose-only stretches (or vice-versa), the most common patterns involved stretches of around 8 or 9 games won (or lost) and then 8 or 9 lost (or won). The greatest total number of games listed, in which a team's sequence consisted only of a fairly long winning and losing streak, was 21: The 1927 Detroit Tigers won 13 straight, then lost the next 8, from August 10-31 of that year (log).
A dramatic example I recalled is that of the 1987 Milwaukee Brewers. The Brewers started off the season with 13 straight wins. The losing streak did not come immediately thereafter, but it wasn't long before they lost 12 straight (log).
Sunday, August 13, 2006
There were a couple of instances of hotness and streakiness in today's 13-0 Cleveland win over Kansas City.
Travis Hafner hit his sixth grand-slam homer of the season, tying Don Mattingly's MLB record. As the linked article notes, "Hafner is 8-for-13 with six homers and 29 RBI this season with the bases loaded." What this means is that, on nearly "Haf" of his bases-loaded at-bats, he has homered (6 of 13)!
The thing about a bases-loaded situation is that, in order to avoid walking in a run, the pitcher is under pressure to keep the ball around the strike zone. This, in turn, presumably allows the batter to concentrate on a smaller area in following an incoming pitch. I'm certainly not saying this accounts completely for Hafner's grand-slam rate, but it's probably a factor.
Hafner's offensive punch was not isolated, however. Cleveland took an 11-0 lead in the first inning, with "[t]he first 10 Indians to bat all reach[ing] base and scor[ing] against Luke Hudson (5-4)."
Travis Hafner hit his sixth grand-slam homer of the season, tying Don Mattingly's MLB record. As the linked article notes, "Hafner is 8-for-13 with six homers and 29 RBI this season with the bases loaded." What this means is that, on nearly "Haf" of his bases-loaded at-bats, he has homered (6 of 13)!
The thing about a bases-loaded situation is that, in order to avoid walking in a run, the pitcher is under pressure to keep the ball around the strike zone. This, in turn, presumably allows the batter to concentrate on a smaller area in following an incoming pitch. I'm certainly not saying this accounts completely for Hafner's grand-slam rate, but it's probably a factor.
Hafner's offensive punch was not isolated, however. Cleveland took an 11-0 lead in the first inning, with "[t]he first 10 Indians to bat all reach[ing] base and scor[ing] against Luke Hudson (5-4)."
Tuesday, August 08, 2006
If it's August, it must be the Oakland A's getting hot again. As of this writing (mid-day Tuesday), the Athletics are 5-1 for August, plus they were also 5-1 in their last six games of July, for a 10-2 stretch overall (game-by-game log for second half of this season).
Looking at the records for previous A's seasons in Baseball Reference, here's how they've done each year of this decade in August:
2000 -- 11-16 (but 21-7 in September)
2001 -- 22-7 (along with 19-8 in July, 17-4 in September, and 6-0 in October)
2002 -- 24-4 (their 20-game win streak was mostly in August, but carried over into September, for which they were 18-8)
2003 -- 20-9
2004 -- 20-8
2005 -- 17-11 (although not as strong as June's 19-8 and July's 20-6)
Excluding 2000, Oakland is 108-40 (.730) in August since 2001.
I haven't decided yet what statistical analyses I might do of this trend. I, like many other people, did analyses to estimate the probability of the A's 2002 winning streak.
I'm pleased to note that in the July 2006 issue of Computers and Operations Research, Donald Martin has just published an article entitled "Hot-hand effects in sports and a recursive method of computing probabilities for streaks,"in which he cites and extends my analysis of the 2002 A's.
Looking at the records for previous A's seasons in Baseball Reference, here's how they've done each year of this decade in August:
2000 -- 11-16 (but 21-7 in September)
2001 -- 22-7 (along with 19-8 in July, 17-4 in September, and 6-0 in October)
2002 -- 24-4 (their 20-game win streak was mostly in August, but carried over into September, for which they were 18-8)
2003 -- 20-9
2004 -- 20-8
2005 -- 17-11 (although not as strong as June's 19-8 and July's 20-6)
Excluding 2000, Oakland is 108-40 (.730) in August since 2001.
I haven't decided yet what statistical analyses I might do of this trend. I, like many other people, did analyses to estimate the probability of the A's 2002 winning streak.
I'm pleased to note that in the July 2006 issue of Computers and Operations Research, Donald Martin has just published an article entitled "Hot-hand effects in sports and a recursive method of computing probabilities for streaks,"in which he cites and extends my analysis of the 2002 A's.
Saturday, August 05, 2006
The Angels and Rangers are playing an afternoon game today, which will be starting shortly. As I've been documenting the last couple of days, the Halos' Vladimir Guerrero has gotten at least one hit in every game he's ever played against the Rangers, 44 games in all. Can the Texas pitchers finally hold him hitless in a game? We'll soon see. Below, I provide real-time commentary...
The Rangers intentionally walk Guerrero in the first inning, with two outs and a runner on second. I think that's a strategically defensible move. The FOX television crew puts up a graphic indicating that Guerrero has a .443 lifetime batting average against the Rangers! (The .443 figure is also documented here, in the Preview section below the box score.)
[As an aside, I'm curious whether all of Guerrero's games against Texas have been as a member of the Angels, for whom he has played since the start of the 2004 season. Vlad, of course, played many years for the National League's Montreal Expos (now Washington Nationals) before coming over to the AL. But, with interleague play, the Expos could have faced the Rangers.
I initially consulted Baseball Reference, finding the Rangers' game-by-game log for 2003. Sure enough, the Rangers played the Expos in a three-game series from June 6-8, 2003. I then looked up the box scores of these games on Retrosheet, and noticed Guerrero was absent from all three. Further research confirmed my guess that he had been injured, this MLB document showing a June 9 action in which Guerrero was placed on the DL, retroactive to June 5. There do not appear to have been any prior interleague Texas-Montreal games.]
Guerrero walks again in the third, the Rangers' John Koronka clearly seeming to be pitching around him. Vlad is known as a free-swinger at the plate, but some of the pitches he was just thrown were too far out of the strike zone even for him.
Another intentional walk in the fourth, in the same situation as earlier: man on second, two outs.
Yet another intentional pass in the sixth inning, with a runner on third and one out.
An amazing catch in right field by the Rangers' Mark DeRosa on a tricky fly ball thwarts Guerrero in the bottom of the eighth. DeRosa was running toward the wall in a somewhat circular path to keep track of the ball and may have been bobbling it as he fell to the ground, but there wasn't any argument over the "out" call. Baseball, of course, has no replay rule, and anyway, none of the camera views provided a conclusive view of what happened. If you look at the linked biographical page on DeRosa, he's listed as a second baseman, but he certainly showed a lot of dexterity in the outfield on Guerrero's fly ball.
That will almost certainly end the streak, as the Angels are unlikely to need their ninth-inning at-bats, leading 10-3.
Yep, the Rangers go down quickly in the ninth. Streak over.
Update: A video of DeRosa catching Guerrero's fly ball is available here. When the new page comes up, select "Top Play: 350 K." First, you will see a different play from the game. When that play is over, look over to the lower-right portion of the page, where some plays are listed (the first one being "Rivera's three-run homer"). Then, scroll down to "DeRosa's falling catch," and select it.
The Rangers intentionally walk Guerrero in the first inning, with two outs and a runner on second. I think that's a strategically defensible move. The FOX television crew puts up a graphic indicating that Guerrero has a .443 lifetime batting average against the Rangers! (The .443 figure is also documented here, in the Preview section below the box score.)
[As an aside, I'm curious whether all of Guerrero's games against Texas have been as a member of the Angels, for whom he has played since the start of the 2004 season. Vlad, of course, played many years for the National League's Montreal Expos (now Washington Nationals) before coming over to the AL. But, with interleague play, the Expos could have faced the Rangers.
I initially consulted Baseball Reference, finding the Rangers' game-by-game log for 2003. Sure enough, the Rangers played the Expos in a three-game series from June 6-8, 2003. I then looked up the box scores of these games on Retrosheet, and noticed Guerrero was absent from all three. Further research confirmed my guess that he had been injured, this MLB document showing a June 9 action in which Guerrero was placed on the DL, retroactive to June 5. There do not appear to have been any prior interleague Texas-Montreal games.]
Guerrero walks again in the third, the Rangers' John Koronka clearly seeming to be pitching around him. Vlad is known as a free-swinger at the plate, but some of the pitches he was just thrown were too far out of the strike zone even for him.
Another intentional walk in the fourth, in the same situation as earlier: man on second, two outs.
Yet another intentional pass in the sixth inning, with a runner on third and one out.
An amazing catch in right field by the Rangers' Mark DeRosa on a tricky fly ball thwarts Guerrero in the bottom of the eighth. DeRosa was running toward the wall in a somewhat circular path to keep track of the ball and may have been bobbling it as he fell to the ground, but there wasn't any argument over the "out" call. Baseball, of course, has no replay rule, and anyway, none of the camera views provided a conclusive view of what happened. If you look at the linked biographical page on DeRosa, he's listed as a second baseman, but he certainly showed a lot of dexterity in the outfield on Guerrero's fly ball.
That will almost certainly end the streak, as the Angels are unlikely to need their ninth-inning at-bats, leading 10-3.
Yep, the Rangers go down quickly in the ninth. Streak over.
Update: A video of DeRosa catching Guerrero's fly ball is available here. When the new page comes up, select "Top Play: 350 K." First, you will see a different play from the game. When that play is over, look over to the lower-right portion of the page, where some plays are listed (the first one being "Rivera's three-run homer"). Then, scroll down to "DeRosa's falling catch," and select it.
Friday, August 04, 2006
Utley-Guerrero Watch
Chase Utley has struck out in the first inning of the Phillies' game against the Mets.
Utley is retired in the third inning on a fly ball to center.
A fly-out to center again in the fifth for Utley.
The streak's going down to the wire -- Utley grounds out in the seventh.
Utley will be the Phillies' lead-off hitter in the top of the ninth. This will probably be his last at-bat, unless the game goes extra innings. Philadelphia currently leads 4-3 over the Mets.
Utley strikes out in the ninth.
Phillies-Mets game over. Utley streak over at 35 games.
Meanwhile, on the opposite coast, the Angels' Vladimir Guerrero has struck out in the second inning against Texas.
Guerrero singles in the third, so he now has at least one hit in all 44 games he's ever played against the Rangers.
According to this article, which I've added after the game, Guerrero "went 2-for-4 to extend one of baseball's most peculiar streaks. He has hit safely in all 44 games he has played against Texas in his career, the longest stretch by any player against one team since 1957 -- which is as far as Stats Inc. has been able to research it."
For background on these hitting streaks, see my Thursday, August 3, posting.
Utley is retired in the third inning on a fly ball to center.
A fly-out to center again in the fifth for Utley.
The streak's going down to the wire -- Utley grounds out in the seventh.
Utley will be the Phillies' lead-off hitter in the top of the ninth. This will probably be his last at-bat, unless the game goes extra innings. Philadelphia currently leads 4-3 over the Mets.
Utley strikes out in the ninth.
Phillies-Mets game over. Utley streak over at 35 games.
Meanwhile, on the opposite coast, the Angels' Vladimir Guerrero has struck out in the second inning against Texas.
Guerrero singles in the third, so he now has at least one hit in all 44 games he's ever played against the Rangers.
According to this article, which I've added after the game, Guerrero "went 2-for-4 to extend one of baseball's most peculiar streaks. He has hit safely in all 44 games he has played against Texas in his career, the longest stretch by any player against one team since 1957 -- which is as far as Stats Inc. has been able to research it."
For background on these hitting streaks, see my Thursday, August 3, posting.
Thursday, August 03, 2006
7:10 pm Central: Baseball fans will be keeping their eyes on two ongoing hitting streaks tonight, one front and center on the MLB landscape and the other more under the radar.
The prominent streak is that of the Phillies' Chase Utley, who last night extended his consecutive hitting stretch to 34 games. In fact, even before I can finish this write-up, Utley has singled in the first inning at St. Louis, extending the streak to 35 games [game article, added later].
He now is 21 games away from tying Joe DiMaggio's legendary 56-game hitting streak. I will analyze Utley's chances of reaching 56 games, later on tonight.
A little over 90 minutes from now, the Angels' Vladimir Guerrero will try to preserve the "other" streak I alluded to. Guerrero has gotten at least one hit in every game he has ever played against the Texas Rangers, 42 games in all.
This article from May, when the Angels and Rangers last met, documents the magnitude of Vlad's accomplishment: the next-longest actively going hitting streak by a player against the same opponent was 18 games (as of when the article was published), and the next-longest hitting streak of this type held at any time in the past by a currently active player is 35 games.
8:30 pm Central: With the Rangers at Angels game about a half-hour away, I thought I'd provide an estimate of Chase Utley's probability of equalling Joe DiMaggio's record 56-game hitting streak.
First, we need a prior (baseline) batting average for Utley. A good figure to use is .290. After his last game of the present season (to this point) without a hit, on June 21, he was batting .290. Also, his batting average for 2005 was .291 (year-by-year stats), so prior to the current hitting streak, Utley appeared to have a stable, long-term average of around .290.
The .290 represents Utley's probability of getting a hit on any single at-bat. However, because a player will usually get around four at-bats per game, the probability of getting at least one hit in a game is considerably higher than the batting average.
Fortunately, a chart exists that allows easy conversion of a batting average into the probability of at least one hit in a game. In Table 1 of the linked document, the closest shown batting average to .290 is .300, which translates into a probability of .745 of getting at least one hit in a game.
We then simply raise .745 to the 21st power (given that Utley's 21 games away from tying DiMaggio), which yields .002, or 1-in-500. This calculation assumes independence of observations, i.e., performance in one game does not affect performance in the next.
Also, as noted in the first linked article in tonight's entry (back up under the 7:10 pm heading), Utley is batting .401 during the streak. A .400 average converts to a .855 probability of gettting at least one hit in a game; .855 to the 21st power is .04, or 1-in-25. This latter estimate, though optimistic, still shows a small likelihood.
10:35 pm Central: A little while ago, Vlad Guerrero homered in the bottom of the fourth inning. He thus has gotten at least one hit in all 43 games he's ever played against the Rangers [game article, added later, which characterizes Guerrero's feat as "the longest such streak against an opponent in the majors for at least 50 years"].
The prominent streak is that of the Phillies' Chase Utley, who last night extended his consecutive hitting stretch to 34 games. In fact, even before I can finish this write-up, Utley has singled in the first inning at St. Louis, extending the streak to 35 games [game article, added later].
He now is 21 games away from tying Joe DiMaggio's legendary 56-game hitting streak. I will analyze Utley's chances of reaching 56 games, later on tonight.
A little over 90 minutes from now, the Angels' Vladimir Guerrero will try to preserve the "other" streak I alluded to. Guerrero has gotten at least one hit in every game he has ever played against the Texas Rangers, 42 games in all.
This article from May, when the Angels and Rangers last met, documents the magnitude of Vlad's accomplishment: the next-longest actively going hitting streak by a player against the same opponent was 18 games (as of when the article was published), and the next-longest hitting streak of this type held at any time in the past by a currently active player is 35 games.
8:30 pm Central: With the Rangers at Angels game about a half-hour away, I thought I'd provide an estimate of Chase Utley's probability of equalling Joe DiMaggio's record 56-game hitting streak.
First, we need a prior (baseline) batting average for Utley. A good figure to use is .290. After his last game of the present season (to this point) without a hit, on June 21, he was batting .290. Also, his batting average for 2005 was .291 (year-by-year stats), so prior to the current hitting streak, Utley appeared to have a stable, long-term average of around .290.
The .290 represents Utley's probability of getting a hit on any single at-bat. However, because a player will usually get around four at-bats per game, the probability of getting at least one hit in a game is considerably higher than the batting average.
Fortunately, a chart exists that allows easy conversion of a batting average into the probability of at least one hit in a game. In Table 1 of the linked document, the closest shown batting average to .290 is .300, which translates into a probability of .745 of getting at least one hit in a game.
We then simply raise .745 to the 21st power (given that Utley's 21 games away from tying DiMaggio), which yields .002, or 1-in-500. This calculation assumes independence of observations, i.e., performance in one game does not affect performance in the next.
Also, as noted in the first linked article in tonight's entry (back up under the 7:10 pm heading), Utley is batting .401 during the streak. A .400 average converts to a .855 probability of gettting at least one hit in a game; .855 to the 21st power is .04, or 1-in-25. This latter estimate, though optimistic, still shows a small likelihood.
10:35 pm Central: A little while ago, Vlad Guerrero homered in the bottom of the fourth inning. He thus has gotten at least one hit in all 43 games he's ever played against the Rangers [game article, added later, which characterizes Guerrero's feat as "the longest such streak against an opponent in the majors for at least 50 years"].
Subscribe to:
Posts (Atom)