I wanted to tie a bow to wrap up three stories I had written about earlier this month:
With their 7-2 win over Boston this afternoon (and the day off tomorrow), the Oakland A's have completed their August games with a 21-6 record (game-by-game log). As I discussed originally in my August 8 posting, the A's have shown an amazing tendency to get hot in August, going back several years. From 2001-2006 inclusive, Oakland's record for games in August is 124-45 (.734)...
A couple of Sundays ago (August 20), I wrote about the Seattle Mariners' record 20-game losing streak within their own division, the American League West. In the time since, the M's have really turned things around (log). After August 20, Seattle went outside of the AL West, winning five out of six games (combined) against the AL East's New York Yankees and Boston Red Sox. These wins, of course, did nothing to end the Mariners' AL West losing streak, but seemed to suggest Seattle had righted the ship. The Mariners then returned to AL West play a couple nights ago, shutting out the Angels 2-0. And tonight, the M's go for a three-game sweep over the Halos...
The Houston Astros' Willy Taveras, about whom I wrote in the posting immediately below the current one, had his consecutive games hitting steak end at 30 on Tuesday night.
Wednesday, August 30, 2006

Sunday, August 27, 2006
The Houston Astros' Willy Taveras has just extended his hitting streak to 30 games, beating out a dribbler toward third base in the first inning at Pittsburgh (I get most Astro and Texas Ranger games on cable TV in Lubbock, Texas, where I live).
The 30-game mark is when I'll generally start to write about hitting streaks. Thirty is a nice round number, and is a little over halfway to Joe DiMaggio's record of 56 games with at least one hit per contest.
It'll probably be several more games before I start presenting calculations of Taveras's probability of catching DiMaggio. To get a feel for the nature of these calculations, however, you can look at this write-up I did for the Phillies' Chase Utley, back when he had a nice streak going (which reached 35 games before ending).
The 30-game mark is when I'll generally start to write about hitting streaks. Thirty is a nice round number, and is a little over halfway to Joe DiMaggio's record of 56 games with at least one hit per contest.
It'll probably be several more games before I start presenting calculations of Taveras's probability of catching DiMaggio. To get a feel for the nature of these calculations, however, you can look at this write-up I did for the Phillies' Chase Utley, back when he had a nice streak going (which reached 35 games before ending).
Sunday, August 20, 2006
The Seattle Mariners have closed out the weekend losing their 20th straight American League Western Division game, 3-2 to the Angels. In terms of consecutive losses within a team's own division, the Mariners have comfortably surpassed two other teams (the 2004 Diamondbacks and 1993 Rockies) who each lost 16 straight divisional games. It was not until 1969 that Major League Baseball -- having expanded from 20 to 24 teams -- introduced Eastern and Western divisions within each league. Prior to that, all the American League teams competed in one set of standings, as did all the National League teams, with the two first-place finishers going directly to the World Series.
Wednesday, August 16, 2006
The L.A. Dodgers' amazing turnaround continues. The Dodgers started off the second half of the season, right after the All-Star Break, by losing 13 out of 14. They've now rebounded by winning 17 of 18 (second half game-by-game log).
Jon Weisman at Dodger Thoughts conveys the strangeness of it all in this essay, a brief excerpt of which follows:
Why does the best Dodger 18-game run in 107 years and best National League run in 20 years feel so unreal? ... A .533 team playing .944 ball after an .071 stretch is hard to wrap the brain around.
(I interpret "best National League run" to mean by any NL team, not the Dodgers' best run through the NL.)
On the SABR members' e-mail discussion forum, the Dodgers' recent streakiness prompted an inquiry into other abrupt turnarounds (thanks primarily to Bob Timmerman and Frank Vaccaro for their messages). Examining the longest win-only stretches followed immediately by the longest lose-only stretches (or vice-versa), the most common patterns involved stretches of around 8 or 9 games won (or lost) and then 8 or 9 lost (or won). The greatest total number of games listed, in which a team's sequence consisted only of a fairly long winning and losing streak, was 21: The 1927 Detroit Tigers won 13 straight, then lost the next 8, from August 10-31 of that year (log).
A dramatic example I recalled is that of the 1987 Milwaukee Brewers. The Brewers started off the season with 13 straight wins. The losing streak did not come immediately thereafter, but it wasn't long before they lost 12 straight (log).
Jon Weisman at Dodger Thoughts conveys the strangeness of it all in this essay, a brief excerpt of which follows:
Why does the best Dodger 18-game run in 107 years and best National League run in 20 years feel so unreal? ... A .533 team playing .944 ball after an .071 stretch is hard to wrap the brain around.
(I interpret "best National League run" to mean by any NL team, not the Dodgers' best run through the NL.)
On the SABR members' e-mail discussion forum, the Dodgers' recent streakiness prompted an inquiry into other abrupt turnarounds (thanks primarily to Bob Timmerman and Frank Vaccaro for their messages). Examining the longest win-only stretches followed immediately by the longest lose-only stretches (or vice-versa), the most common patterns involved stretches of around 8 or 9 games won (or lost) and then 8 or 9 lost (or won). The greatest total number of games listed, in which a team's sequence consisted only of a fairly long winning and losing streak, was 21: The 1927 Detroit Tigers won 13 straight, then lost the next 8, from August 10-31 of that year (log).
A dramatic example I recalled is that of the 1987 Milwaukee Brewers. The Brewers started off the season with 13 straight wins. The losing streak did not come immediately thereafter, but it wasn't long before they lost 12 straight (log).
Sunday, August 13, 2006
There were a couple of instances of hotness and streakiness in today's 13-0 Cleveland win over Kansas City.
Travis Hafner hit his sixth grand-slam homer of the season, tying Don Mattingly's MLB record. As the linked article notes, "Hafner is 8-for-13 with six homers and 29 RBI this season with the bases loaded." What this means is that, on nearly "Haf" of his bases-loaded at-bats, he has homered (6 of 13)!
The thing about a bases-loaded situation is that, in order to avoid walking in a run, the pitcher is under pressure to keep the ball around the strike zone. This, in turn, presumably allows the batter to concentrate on a smaller area in following an incoming pitch. I'm certainly not saying this accounts completely for Hafner's grand-slam rate, but it's probably a factor.
Hafner's offensive punch was not isolated, however. Cleveland took an 11-0 lead in the first inning, with "[t]he first 10 Indians to bat all reach[ing] base and scor[ing] against Luke Hudson (5-4)."
Travis Hafner hit his sixth grand-slam homer of the season, tying Don Mattingly's MLB record. As the linked article notes, "Hafner is 8-for-13 with six homers and 29 RBI this season with the bases loaded." What this means is that, on nearly "Haf" of his bases-loaded at-bats, he has homered (6 of 13)!
The thing about a bases-loaded situation is that, in order to avoid walking in a run, the pitcher is under pressure to keep the ball around the strike zone. This, in turn, presumably allows the batter to concentrate on a smaller area in following an incoming pitch. I'm certainly not saying this accounts completely for Hafner's grand-slam rate, but it's probably a factor.
Hafner's offensive punch was not isolated, however. Cleveland took an 11-0 lead in the first inning, with "[t]he first 10 Indians to bat all reach[ing] base and scor[ing] against Luke Hudson (5-4)."
Tuesday, August 08, 2006
If it's August, it must be the Oakland A's getting hot again. As of this writing (mid-day Tuesday), the Athletics are 5-1 for August, plus they were also 5-1 in their last six games of July, for a 10-2 stretch overall (game-by-game log for second half of this season).
Looking at the records for previous A's seasons in Baseball Reference, here's how they've done each year of this decade in August:
2000 -- 11-16 (but 21-7 in September)
2001 -- 22-7 (along with 19-8 in July, 17-4 in September, and 6-0 in October)
2002 -- 24-4 (their 20-game win streak was mostly in August, but carried over into September, for which they were 18-8)
2003 -- 20-9
2004 -- 20-8
2005 -- 17-11 (although not as strong as June's 19-8 and July's 20-6)
Excluding 2000, Oakland is 108-40 (.730) in August since 2001.
I haven't decided yet what statistical analyses I might do of this trend. I, like many other people, did analyses to estimate the probability of the A's 2002 winning streak.
I'm pleased to note that in the July 2006 issue of Computers and Operations Research, Donald Martin has just published an article entitled "Hot-hand effects in sports and a recursive method of computing probabilities for streaks,"in which he cites and extends my analysis of the 2002 A's.
Looking at the records for previous A's seasons in Baseball Reference, here's how they've done each year of this decade in August:
2000 -- 11-16 (but 21-7 in September)
2001 -- 22-7 (along with 19-8 in July, 17-4 in September, and 6-0 in October)
2002 -- 24-4 (their 20-game win streak was mostly in August, but carried over into September, for which they were 18-8)
2003 -- 20-9
2004 -- 20-8
2005 -- 17-11 (although not as strong as June's 19-8 and July's 20-6)
Excluding 2000, Oakland is 108-40 (.730) in August since 2001.
I haven't decided yet what statistical analyses I might do of this trend. I, like many other people, did analyses to estimate the probability of the A's 2002 winning streak.
I'm pleased to note that in the July 2006 issue of Computers and Operations Research, Donald Martin has just published an article entitled "Hot-hand effects in sports and a recursive method of computing probabilities for streaks,"in which he cites and extends my analysis of the 2002 A's.
Saturday, August 05, 2006
The Angels and Rangers are playing an afternoon game today, which will be starting shortly. As I've been documenting the last couple of days, the Halos' Vladimir Guerrero has gotten at least one hit in every game he's ever played against the Rangers, 44 games in all. Can the Texas pitchers finally hold him hitless in a game? We'll soon see. Below, I provide real-time commentary...
The Rangers intentionally walk Guerrero in the first inning, with two outs and a runner on second. I think that's a strategically defensible move. The FOX television crew puts up a graphic indicating that Guerrero has a .443 lifetime batting average against the Rangers! (The .443 figure is also documented here, in the Preview section below the box score.)
[As an aside, I'm curious whether all of Guerrero's games against Texas have been as a member of the Angels, for whom he has played since the start of the 2004 season. Vlad, of course, played many years for the National League's Montreal Expos (now Washington Nationals) before coming over to the AL. But, with interleague play, the Expos could have faced the Rangers.
I initially consulted Baseball Reference, finding the Rangers' game-by-game log for 2003. Sure enough, the Rangers played the Expos in a three-game series from June 6-8, 2003. I then looked up the box scores of these games on Retrosheet, and noticed Guerrero was absent from all three. Further research confirmed my guess that he had been injured, this MLB document showing a June 9 action in which Guerrero was placed on the DL, retroactive to June 5. There do not appear to have been any prior interleague Texas-Montreal games.]
Guerrero walks again in the third, the Rangers' John Koronka clearly seeming to be pitching around him. Vlad is known as a free-swinger at the plate, but some of the pitches he was just thrown were too far out of the strike zone even for him.
Another intentional walk in the fourth, in the same situation as earlier: man on second, two outs.
Yet another intentional pass in the sixth inning, with a runner on third and one out.
An amazing catch in right field by the Rangers' Mark DeRosa on a tricky fly ball thwarts Guerrero in the bottom of the eighth. DeRosa was running toward the wall in a somewhat circular path to keep track of the ball and may have been bobbling it as he fell to the ground, but there wasn't any argument over the "out" call. Baseball, of course, has no replay rule, and anyway, none of the camera views provided a conclusive view of what happened. If you look at the linked biographical page on DeRosa, he's listed as a second baseman, but he certainly showed a lot of dexterity in the outfield on Guerrero's fly ball.
That will almost certainly end the streak, as the Angels are unlikely to need their ninth-inning at-bats, leading 10-3.
Yep, the Rangers go down quickly in the ninth. Streak over.
Update: A video of DeRosa catching Guerrero's fly ball is available here. When the new page comes up, select "Top Play: 350 K." First, you will see a different play from the game. When that play is over, look over to the lower-right portion of the page, where some plays are listed (the first one being "Rivera's three-run homer"). Then, scroll down to "DeRosa's falling catch," and select it.
The Rangers intentionally walk Guerrero in the first inning, with two outs and a runner on second. I think that's a strategically defensible move. The FOX television crew puts up a graphic indicating that Guerrero has a .443 lifetime batting average against the Rangers! (The .443 figure is also documented here, in the Preview section below the box score.)
[As an aside, I'm curious whether all of Guerrero's games against Texas have been as a member of the Angels, for whom he has played since the start of the 2004 season. Vlad, of course, played many years for the National League's Montreal Expos (now Washington Nationals) before coming over to the AL. But, with interleague play, the Expos could have faced the Rangers.
I initially consulted Baseball Reference, finding the Rangers' game-by-game log for 2003. Sure enough, the Rangers played the Expos in a three-game series from June 6-8, 2003. I then looked up the box scores of these games on Retrosheet, and noticed Guerrero was absent from all three. Further research confirmed my guess that he had been injured, this MLB document showing a June 9 action in which Guerrero was placed on the DL, retroactive to June 5. There do not appear to have been any prior interleague Texas-Montreal games.]
Guerrero walks again in the third, the Rangers' John Koronka clearly seeming to be pitching around him. Vlad is known as a free-swinger at the plate, but some of the pitches he was just thrown were too far out of the strike zone even for him.
Another intentional walk in the fourth, in the same situation as earlier: man on second, two outs.
Yet another intentional pass in the sixth inning, with a runner on third and one out.
An amazing catch in right field by the Rangers' Mark DeRosa on a tricky fly ball thwarts Guerrero in the bottom of the eighth. DeRosa was running toward the wall in a somewhat circular path to keep track of the ball and may have been bobbling it as he fell to the ground, but there wasn't any argument over the "out" call. Baseball, of course, has no replay rule, and anyway, none of the camera views provided a conclusive view of what happened. If you look at the linked biographical page on DeRosa, he's listed as a second baseman, but he certainly showed a lot of dexterity in the outfield on Guerrero's fly ball.
That will almost certainly end the streak, as the Angels are unlikely to need their ninth-inning at-bats, leading 10-3.
Yep, the Rangers go down quickly in the ninth. Streak over.
Update: A video of DeRosa catching Guerrero's fly ball is available here. When the new page comes up, select "Top Play: 350 K." First, you will see a different play from the game. When that play is over, look over to the lower-right portion of the page, where some plays are listed (the first one being "Rivera's three-run homer"). Then, scroll down to "DeRosa's falling catch," and select it.
Friday, August 04, 2006
Utley-Guerrero Watch
Chase Utley has struck out in the first inning of the Phillies' game against the Mets.
Utley is retired in the third inning on a fly ball to center.
A fly-out to center again in the fifth for Utley.
The streak's going down to the wire -- Utley grounds out in the seventh.
Utley will be the Phillies' lead-off hitter in the top of the ninth. This will probably be his last at-bat, unless the game goes extra innings. Philadelphia currently leads 4-3 over the Mets.
Utley strikes out in the ninth.
Phillies-Mets game over. Utley streak over at 35 games.
Meanwhile, on the opposite coast, the Angels' Vladimir Guerrero has struck out in the second inning against Texas.
Guerrero singles in the third, so he now has at least one hit in all 44 games he's ever played against the Rangers.
According to this article, which I've added after the game, Guerrero "went 2-for-4 to extend one of baseball's most peculiar streaks. He has hit safely in all 44 games he has played against Texas in his career, the longest stretch by any player against one team since 1957 -- which is as far as Stats Inc. has been able to research it."
For background on these hitting streaks, see my Thursday, August 3, posting.
Utley is retired in the third inning on a fly ball to center.
A fly-out to center again in the fifth for Utley.
The streak's going down to the wire -- Utley grounds out in the seventh.
Utley will be the Phillies' lead-off hitter in the top of the ninth. This will probably be his last at-bat, unless the game goes extra innings. Philadelphia currently leads 4-3 over the Mets.
Utley strikes out in the ninth.
Phillies-Mets game over. Utley streak over at 35 games.
Meanwhile, on the opposite coast, the Angels' Vladimir Guerrero has struck out in the second inning against Texas.
Guerrero singles in the third, so he now has at least one hit in all 44 games he's ever played against the Rangers.
According to this article, which I've added after the game, Guerrero "went 2-for-4 to extend one of baseball's most peculiar streaks. He has hit safely in all 44 games he has played against Texas in his career, the longest stretch by any player against one team since 1957 -- which is as far as Stats Inc. has been able to research it."
For background on these hitting streaks, see my Thursday, August 3, posting.
Thursday, August 03, 2006
7:10 pm Central: Baseball fans will be keeping their eyes on two ongoing hitting streaks tonight, one front and center on the MLB landscape and the other more under the radar.
The prominent streak is that of the Phillies' Chase Utley, who last night extended his consecutive hitting stretch to 34 games. In fact, even before I can finish this write-up, Utley has singled in the first inning at St. Louis, extending the streak to 35 games [game article, added later].
He now is 21 games away from tying Joe DiMaggio's legendary 56-game hitting streak. I will analyze Utley's chances of reaching 56 games, later on tonight.
A little over 90 minutes from now, the Angels' Vladimir Guerrero will try to preserve the "other" streak I alluded to. Guerrero has gotten at least one hit in every game he has ever played against the Texas Rangers, 42 games in all.
This article from May, when the Angels and Rangers last met, documents the magnitude of Vlad's accomplishment: the next-longest actively going hitting streak by a player against the same opponent was 18 games (as of when the article was published), and the next-longest hitting streak of this type held at any time in the past by a currently active player is 35 games.
8:30 pm Central: With the Rangers at Angels game about a half-hour away, I thought I'd provide an estimate of Chase Utley's probability of equalling Joe DiMaggio's record 56-game hitting streak.
First, we need a prior (baseline) batting average for Utley. A good figure to use is .290. After his last game of the present season (to this point) without a hit, on June 21, he was batting .290. Also, his batting average for 2005 was .291 (year-by-year stats), so prior to the current hitting streak, Utley appeared to have a stable, long-term average of around .290.
The .290 represents Utley's probability of getting a hit on any single at-bat. However, because a player will usually get around four at-bats per game, the probability of getting at least one hit in a game is considerably higher than the batting average.
Fortunately, a chart exists that allows easy conversion of a batting average into the probability of at least one hit in a game. In Table 1 of the linked document, the closest shown batting average to .290 is .300, which translates into a probability of .745 of getting at least one hit in a game.
We then simply raise .745 to the 21st power (given that Utley's 21 games away from tying DiMaggio), which yields .002, or 1-in-500. This calculation assumes independence of observations, i.e., performance in one game does not affect performance in the next.
Also, as noted in the first linked article in tonight's entry (back up under the 7:10 pm heading), Utley is batting .401 during the streak. A .400 average converts to a .855 probability of gettting at least one hit in a game; .855 to the 21st power is .04, or 1-in-25. This latter estimate, though optimistic, still shows a small likelihood.
10:35 pm Central: A little while ago, Vlad Guerrero homered in the bottom of the fourth inning. He thus has gotten at least one hit in all 43 games he's ever played against the Rangers [game article, added later, which characterizes Guerrero's feat as "the longest such streak against an opponent in the majors for at least 50 years"].
The prominent streak is that of the Phillies' Chase Utley, who last night extended his consecutive hitting stretch to 34 games. In fact, even before I can finish this write-up, Utley has singled in the first inning at St. Louis, extending the streak to 35 games [game article, added later].
He now is 21 games away from tying Joe DiMaggio's legendary 56-game hitting streak. I will analyze Utley's chances of reaching 56 games, later on tonight.
A little over 90 minutes from now, the Angels' Vladimir Guerrero will try to preserve the "other" streak I alluded to. Guerrero has gotten at least one hit in every game he has ever played against the Texas Rangers, 42 games in all.
This article from May, when the Angels and Rangers last met, documents the magnitude of Vlad's accomplishment: the next-longest actively going hitting streak by a player against the same opponent was 18 games (as of when the article was published), and the next-longest hitting streak of this type held at any time in the past by a currently active player is 35 games.
8:30 pm Central: With the Rangers at Angels game about a half-hour away, I thought I'd provide an estimate of Chase Utley's probability of equalling Joe DiMaggio's record 56-game hitting streak.
First, we need a prior (baseline) batting average for Utley. A good figure to use is .290. After his last game of the present season (to this point) without a hit, on June 21, he was batting .290. Also, his batting average for 2005 was .291 (year-by-year stats), so prior to the current hitting streak, Utley appeared to have a stable, long-term average of around .290.
The .290 represents Utley's probability of getting a hit on any single at-bat. However, because a player will usually get around four at-bats per game, the probability of getting at least one hit in a game is considerably higher than the batting average.
Fortunately, a chart exists that allows easy conversion of a batting average into the probability of at least one hit in a game. In Table 1 of the linked document, the closest shown batting average to .290 is .300, which translates into a probability of .745 of getting at least one hit in a game.
We then simply raise .745 to the 21st power (given that Utley's 21 games away from tying DiMaggio), which yields .002, or 1-in-500. This calculation assumes independence of observations, i.e., performance in one game does not affect performance in the next.
Also, as noted in the first linked article in tonight's entry (back up under the 7:10 pm heading), Utley is batting .401 during the streak. A .400 average converts to a .855 probability of gettting at least one hit in a game; .855 to the 21st power is .04, or 1-in-25. This latter estimate, though optimistic, still shows a small likelihood.
10:35 pm Central: A little while ago, Vlad Guerrero homered in the bottom of the fourth inning. He thus has gotten at least one hit in all 43 games he's ever played against the Rangers [game article, added later, which characterizes Guerrero's feat as "the longest such streak against an opponent in the majors for at least 50 years"].
Monday, July 31, 2006
Right here in Lubbock, at Texas Tech University's Rawls golf course, located about a mile and a half from my office, a 53-year-old gentleman named Danny Leake shot a hole-in-one at the same hole (the sixth) this past Saturday and Sunday. According to the article in the Lubbock Avalanche Journal (registration required), the hole had distances of 174 and 178 yards the two days, differing as a result of pin placement on the green.
I was very pleased to see the A-J article probe the statistical aspects of Mr. Leake's accomplishment, drawing from a set of probability estimates of various hole-in-one phenomena made years earlier by mathematician Francis Scheid for Golf Digest. Scheid's estimates are also shown here, in the yellow-shaded sidebar to a 2005 Golf Digest article (toward the bottom of the page that comes up).
What Leake exhibited is nothing, if not a hot hand, so I had to pursue the topic further. The neatest thing I found was an amazing USA Today page on holes-in-one, which includes links to a compilation of all aces on the PGA tour from 1990 to mid-2006, and to a similar compilation for the LPGA tour (beginning in 1992).
The sidebar accompanying the aforementioned 2005 Golf Digest article stated, among other things, that the odds of an "[a]verage player acing [a] 150-yard hole" were 80,000 to 1, and for a 200-yard hole, 150,000 to 1. Technically, odds are not the same thing as probabilities, but for extremely rare occurrences, the terms converge.
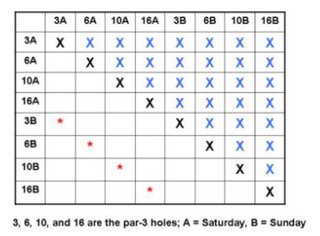
As noted above, the hole that Leake aced twice had a distance of roughly 175 yards from the tee, halfway between the two figures cited in the previous paragraph. Let's use the odds for a 150-yard hole (80,000 to 1). At this point, I'd like to introduce a new twist; some may disagree with this way of addressing the question, but it seems reasonable to me. Even though there are 18 holes in a round of golf, holes-in-one seem to come exclusively (or almost exclusively) on par-3 holes. Texas Tech's Rawls course had four such holes, numbers 3, 6, 10, and 16. In two days, a golfer would thus get to play par-3 holes eight times total.
We can then ask, given a prior probability of 1-in-80,000 (.0000125) of a hole-in-one from a single attempt off the tee, what is the probability of someone acing two (or more) holes in eight opportunities? An online binomial calculator tells us that such probability is .000000004 or 1-in-250 million.
That, however, would be for making a hole-in-one on any two holes out of eight (i.e., the two aces could come from among the four par-3 holes on one day, or from one hole each on the two days and, if the latter, they could be on same hole or different holes).
We have to restrict the situation to scoring the aces on the same hole both days. I've created a chart (below) to illustrate that there are 28 possible ways to ace two holes out of eight, some on the same day, others on different days. The main diagonal is removed (signified by black X's) because, for example, a golfer could not ace Hole No. 3 twice the same day. The 28 blue X's above the diagonal indicate redundancy with the 28 cells below the diagonal. The cells with no X's thus represent the 28 possible ways to ace two holes out of eight. Finally, there are only four cells (indicated by red asterisks) where the golfer would be acing the same hole on back-to-back days. So, among the 28 ways to get two holes-in-one out of eight holes generally, only four ways fit with what happened in Lubbock, and of course 4/28 = 1/7.
We thus multiply our prior value of 1-in-250 million by 1/7, yielding 1 in 1.75 billion. That's my best guess!
I was very pleased to see the A-J article probe the statistical aspects of Mr. Leake's accomplishment, drawing from a set of probability estimates of various hole-in-one phenomena made years earlier by mathematician Francis Scheid for Golf Digest. Scheid's estimates are also shown here, in the yellow-shaded sidebar to a 2005 Golf Digest article (toward the bottom of the page that comes up).
What Leake exhibited is nothing, if not a hot hand, so I had to pursue the topic further. The neatest thing I found was an amazing USA Today page on holes-in-one, which includes links to a compilation of all aces on the PGA tour from 1990 to mid-2006, and to a similar compilation for the LPGA tour (beginning in 1992).
The sidebar accompanying the aforementioned 2005 Golf Digest article stated, among other things, that the odds of an "[a]verage player acing [a] 150-yard hole" were 80,000 to 1, and for a 200-yard hole, 150,000 to 1. Technically, odds are not the same thing as probabilities, but for extremely rare occurrences, the terms converge.
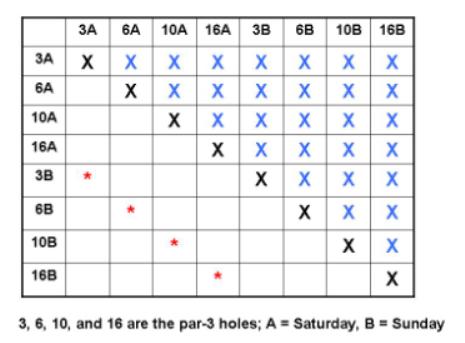
As noted above, the hole that Leake aced twice had a distance of roughly 175 yards from the tee, halfway between the two figures cited in the previous paragraph. Let's use the odds for a 150-yard hole (80,000 to 1). At this point, I'd like to introduce a new twist; some may disagree with this way of addressing the question, but it seems reasonable to me. Even though there are 18 holes in a round of golf, holes-in-one seem to come exclusively (or almost exclusively) on par-3 holes. Texas Tech's Rawls course had four such holes, numbers 3, 6, 10, and 16. In two days, a golfer would thus get to play par-3 holes eight times total.
We can then ask, given a prior probability of 1-in-80,000 (.0000125) of a hole-in-one from a single attempt off the tee, what is the probability of someone acing two (or more) holes in eight opportunities? An online binomial calculator tells us that such probability is .000000004 or 1-in-250 million.
That, however, would be for making a hole-in-one on any two holes out of eight (i.e., the two aces could come from among the four par-3 holes on one day, or from one hole each on the two days and, if the latter, they could be on same hole or different holes).
We have to restrict the situation to scoring the aces on the same hole both days. I've created a chart (below) to illustrate that there are 28 possible ways to ace two holes out of eight, some on the same day, others on different days. The main diagonal is removed (signified by black X's) because, for example, a golfer could not ace Hole No. 3 twice the same day. The 28 blue X's above the diagonal indicate redundancy with the 28 cells below the diagonal. The cells with no X's thus represent the 28 possible ways to ace two holes out of eight. Finally, there are only four cells (indicated by red asterisks) where the golfer would be acing the same hole on back-to-back days. So, among the 28 ways to get two holes-in-one out of eight holes generally, only four ways fit with what happened in Lubbock, and of course 4/28 = 1/7.
We thus multiply our prior value of 1-in-250 million by 1/7, yielding 1 in 1.75 billion. That's my best guess!
Sunday, July 30, 2006
Just a few quick items in connection with today's Major League Baseball action...
When I saw the Houston Astros were pinch-hitting for Brad Ausmus late in this afternoon's game against Arizona, it reminded me of a write-up I was planning to do.
A little while back, a discussant known as "TechTown" on the RaiderPower.com Texas Tech sports chat site pointed out that Ausmus had gone through a 0-for-40 hitting drought in late June and early July. Hence, it was no surprise to me when Ausmus was lifted today.
Looking at Ausmus's statistics, for the last couple of years and for his career, he's roughly a .250 hitter. That means that on any given official at-bat, he has about a .75 probability of making an out. Raising .75 to the 40th power (for the length of the slump) yields .00001 as the probability of Ausmus's drought, assuming independence of at-bats (i.e., that the outcome of any one at-bat has no effect on the next at-bat, like coin-flipping).
In other news, the Cubs recorded their first home four-game sweep of the Cardinals since 1972, and the Mets swept the Braves in Atlanta for the first time since 1985.
When I saw the Houston Astros were pinch-hitting for Brad Ausmus late in this afternoon's game against Arizona, it reminded me of a write-up I was planning to do.
A little while back, a discussant known as "TechTown" on the RaiderPower.com Texas Tech sports chat site pointed out that Ausmus had gone through a 0-for-40 hitting drought in late June and early July. Hence, it was no surprise to me when Ausmus was lifted today.
Looking at Ausmus's statistics, for the last couple of years and for his career, he's roughly a .250 hitter. That means that on any given official at-bat, he has about a .75 probability of making an out. Raising .75 to the 40th power (for the length of the slump) yields .00001 as the probability of Ausmus's drought, assuming independence of at-bats (i.e., that the outcome of any one at-bat has no effect on the next at-bat, like coin-flipping).
In other news, the Cubs recorded their first home four-game sweep of the Cardinals since 1972, and the Mets swept the Braves in Atlanta for the first time since 1985.
Saturday, July 29, 2006
I typically don't write much about tennis. However, I've just been watching taped coverage on cable television's Tennis Channel of the Dominik Hrbaty-Robby Ginepri quarter-final match in the Countrywide Classic from UCLA's L.A. Tennis Center (UCLA being my undergraduate college alma mater).
I came across the match midway through, and when I heard the announcers saying that Hrbaty had won several straight points, my ears naturally perked up. Being the streak fanatic that I am, I kept rooting for Hrbaty to win more points (or conversely for Ginepri to lose more points) and it kept happening. By the time Hrbaty's run ended, he had won 18 straight points!
This summary on the men's ATP tour website says that Hrbaty won 19 straight points. But even by its own enumeration of the sequence, the article confirms it was actually 18 points:
After a tight start to the match Domink Hrbaty blew open his quarterfinal with Robby Ginepri, winning 19 straight points at one stage en route to a 7-6(0), 6-2 win.
Hrbaty won 19 straight points starting with the last point of the 12th game of the opening set. He then won the tie-break to love, held serve to love to open the second set, then broke Ginepri to love in the second game. He won the first two points of the third game before conceding the first point to Ginepri with a double fault. Ginepri won just 19 second set points.
Last point of the 12th game of 1st set = 1
Tie-breaker 7-0 = 7 (8 cumulatively)
2nd set, 1st game at love = 4 (12 cumulatively)
...........2nd game at love = 4 (16 cumulatively)
...........3rd game, first 2 points = 2 (18 cumulatively)
Inquiry into streakiness -- and other statistical phenomena -- in tennis is not limited to anecdotes, however.
Economist Franc Klaassen of the Universiteit van Amsterdam, in collaboration with Jan Magnus, has published a number of articles on tennis (click here for a list of Klaasen's publications, containing links to the articles themselves). Of particular interest to aficionados of streakiness is the following article:
Klaassen, F.J.G.M. and J.R. Magnus (2001), “Are Points in Tennis Independent and Identically Distributed? Evidence from a Dynamic Binary Panel Data Model,” Journal of the American Statistical Association, 96, 500-509.
By "independent," researchers mean that the outcome of one point has no bearing on the outcome of the next, just like coin-flipping. The opposite would be "dependence," as in streakiness or momentum, where winning one point would increase one's probability of winning the next point.
The aforementioned article studied singles play at Wimbledon. Putting aside the intense statistical aspects, Klaasen and Magnus reached the following conclusion:
The independence hypothesis... is rejected with a p-value of 1.7% (men) and 0.3%(women)... Winning the previous point has a positive effect on winning the current point, both for men and for women,...
(Readers with statistical training will know that for a result to attain "statistical significance," it must have a probability of 5% or less [p < .05] of occurring purely by chance.)
Tennis, in fact, is one of the few sports in which streakiness (or momentum) appears to be fairly well documented, in not just the Klaasen and Magnus study, but also in earlier research by Jackson and Mosurski. Studies of tasks such as basketball shooting and baseball hitting generally have not been able to reject independence (in the various links sections on the right-hand side of this page, see the pages of S.C. Albright, Tom Gilovich, and Jay Koehler, as well as the link to a hot hand bibliography further down, for details).
I came across the match midway through, and when I heard the announcers saying that Hrbaty had won several straight points, my ears naturally perked up. Being the streak fanatic that I am, I kept rooting for Hrbaty to win more points (or conversely for Ginepri to lose more points) and it kept happening. By the time Hrbaty's run ended, he had won 18 straight points!
This summary on the men's ATP tour website says that Hrbaty won 19 straight points. But even by its own enumeration of the sequence, the article confirms it was actually 18 points:
After a tight start to the match Domink Hrbaty blew open his quarterfinal with Robby Ginepri, winning 19 straight points at one stage en route to a 7-6(0), 6-2 win.
Hrbaty won 19 straight points starting with the last point of the 12th game of the opening set. He then won the tie-break to love, held serve to love to open the second set, then broke Ginepri to love in the second game. He won the first two points of the third game before conceding the first point to Ginepri with a double fault. Ginepri won just 19 second set points.
Last point of the 12th game of 1st set = 1
Tie-breaker 7-0 = 7 (8 cumulatively)
2nd set, 1st game at love = 4 (12 cumulatively)
...........2nd game at love = 4 (16 cumulatively)
...........3rd game, first 2 points = 2 (18 cumulatively)
Inquiry into streakiness -- and other statistical phenomena -- in tennis is not limited to anecdotes, however.
Economist Franc Klaassen of the Universiteit van Amsterdam, in collaboration with Jan Magnus, has published a number of articles on tennis (click here for a list of Klaasen's publications, containing links to the articles themselves). Of particular interest to aficionados of streakiness is the following article:
Klaassen, F.J.G.M. and J.R. Magnus (2001), “Are Points in Tennis Independent and Identically Distributed? Evidence from a Dynamic Binary Panel Data Model,” Journal of the American Statistical Association, 96, 500-509.
By "independent," researchers mean that the outcome of one point has no bearing on the outcome of the next, just like coin-flipping. The opposite would be "dependence," as in streakiness or momentum, where winning one point would increase one's probability of winning the next point.
The aforementioned article studied singles play at Wimbledon. Putting aside the intense statistical aspects, Klaasen and Magnus reached the following conclusion:
The independence hypothesis... is rejected with a p-value of 1.7% (men) and 0.3%(women)... Winning the previous point has a positive effect on winning the current point, both for men and for women,...
(Readers with statistical training will know that for a result to attain "statistical significance," it must have a probability of 5% or less [p < .05] of occurring purely by chance.)
Tennis, in fact, is one of the few sports in which streakiness (or momentum) appears to be fairly well documented, in not just the Klaasen and Magnus study, but also in earlier research by Jackson and Mosurski. Studies of tasks such as basketball shooting and baseball hitting generally have not been able to reject independence (in the various links sections on the right-hand side of this page, see the pages of S.C. Albright, Tom Gilovich, and Jay Koehler, as well as the link to a hot hand bibliography further down, for details).
Wednesday, July 19, 2006
About two months ago, while attending a conference on networks at Indiana University Bloomington (see photos on another of my blogs), I visited with psychology professor Steven "Jim" Sherman, whom I have known for over 20 years. I first met Jim in the spring of 1984, while visiting IUB on a trip to look at potential places to go to graduate school (I ultimately chose the University of Michigan).
I would occasionally see Jim at conferences over the years, and then out of the blue, I got a call from him some time in the fall of 2002. Jim invited me to a small, informal conference he was co-organizing on statistics and sports decision-making to be held in March 2003 in Scottsdale, Arizona (to enable conference attendees to attend spring training if they wanted!). A photo of the participants in that gathering is shown below.

Jim is shown front and center in the shorts, flanked to his right by University of Chicago professor Richard Thaler, the other co-organizer. Right behind Jim is Cornell's Tom Gilovich, who was the lead author on the 1985 article that introduced hot hand research. Right behind Tom (skipping the gap in the third row), is me, at the center of the back row. To my right is legendary baseball analyst Bill James, and in front of Bill, to his right, is fellow baseball expert Rob Neyer.
Anyway, back to my visit with Jim in May 2006. As I was entering his office for our meeting, I noticed he had a letter Scotch-taped to his door. The letter, dating back more than 20 years, was from former Indiana men's basketball coach Bob Knight, now, of course, the coach where I'm located, Texas Tech University. And the letter pertained to, of all things, the hot hand. As it turns out, Jim had sent Coach Knight a copy of the aforementioned mid-1980s article by Gilovich and colleagues, and Knight had sent this reply...
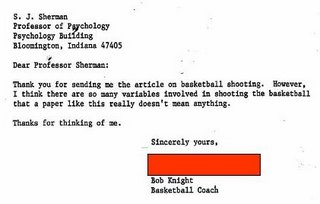
The letter has been on Sherman's door for over 20 years, for all passersby to see. Given the letter's status as an historic artifact (sometimes spelled artefact) in the annals of hot hand research, I asked Jim if we could make a copy of it for posting on my website, and he agreed. (I figured that most people probably wouldn't want their signature broadcast to the world, so I blocked out Coach Knight's.)
Coach Knight's skepticism of hot hand research -- the general finding of which is that making one or more shots in a row does not tend to raise a shooter's likelihood of making the next shot -- has been reported previously, in this Wikipedia entry on the "Clustering Illusion" (of which I am not the author). Still, I thought it would be neat to display a copy of the original letter. By the way, Boston Celtic coaching great Red Auerbach has also expressed skepticism.
Knight is absolutely right about the multitude of factors that determine whether a basketball shot will go in or not. Many researchers have voiced similar concerns, such as the possibility that the inability to detect streakiness could stem from players who just made a shot being guarded more closely the next time, or feeling more confident and shooting from farther away. In an attempt to eliminate as many extraneous factors as possible, researchers have used controlled shooting exercises, such as the NBA three-point shooting contest the night before the All-Star Game. Still, little evidence of streakiness has been observed (see the Koehler & Conley [2003] paper at the following site).
I would occasionally see Jim at conferences over the years, and then out of the blue, I got a call from him some time in the fall of 2002. Jim invited me to a small, informal conference he was co-organizing on statistics and sports decision-making to be held in March 2003 in Scottsdale, Arizona (to enable conference attendees to attend spring training if they wanted!). A photo of the participants in that gathering is shown below.

Jim is shown front and center in the shorts, flanked to his right by University of Chicago professor Richard Thaler, the other co-organizer. Right behind Jim is Cornell's Tom Gilovich, who was the lead author on the 1985 article that introduced hot hand research. Right behind Tom (skipping the gap in the third row), is me, at the center of the back row. To my right is legendary baseball analyst Bill James, and in front of Bill, to his right, is fellow baseball expert Rob Neyer.
Anyway, back to my visit with Jim in May 2006. As I was entering his office for our meeting, I noticed he had a letter Scotch-taped to his door. The letter, dating back more than 20 years, was from former Indiana men's basketball coach Bob Knight, now, of course, the coach where I'm located, Texas Tech University. And the letter pertained to, of all things, the hot hand. As it turns out, Jim had sent Coach Knight a copy of the aforementioned mid-1980s article by Gilovich and colleagues, and Knight had sent this reply...
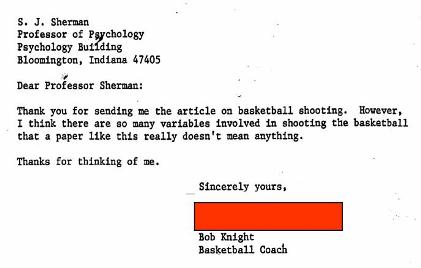
The letter has been on Sherman's door for over 20 years, for all passersby to see. Given the letter's status as an historic artifact (sometimes spelled artefact) in the annals of hot hand research, I asked Jim if we could make a copy of it for posting on my website, and he agreed. (I figured that most people probably wouldn't want their signature broadcast to the world, so I blocked out Coach Knight's.)
Coach Knight's skepticism of hot hand research -- the general finding of which is that making one or more shots in a row does not tend to raise a shooter's likelihood of making the next shot -- has been reported previously, in this Wikipedia entry on the "Clustering Illusion" (of which I am not the author). Still, I thought it would be neat to display a copy of the original letter. By the way, Boston Celtic coaching great Red Auerbach has also expressed skepticism.
Knight is absolutely right about the multitude of factors that determine whether a basketball shot will go in or not. Many researchers have voiced similar concerns, such as the possibility that the inability to detect streakiness could stem from players who just made a shot being guarded more closely the next time, or feeling more confident and shooting from farther away. In an attempt to eliminate as many extraneous factors as possible, researchers have used controlled shooting exercises, such as the NBA three-point shooting contest the night before the All-Star Game. Still, little evidence of streakiness has been observed (see the Koehler & Conley [2003] paper at the following site).
Monday, July 17, 2006
Chipper Jones of the Atlanta Braves saw his streak of 14 straight games with an extra-base hit end tonight. He had tied the previous major-league record.
Thursday, July 06, 2006

I recently returned from Seattle, where I attended the Society for American Baseball Research (SABR) conference and presented a research poster entitled "Top Major League Baseball Streaks of 2005."
To the right is the city's famous Space Needle, of which I snapped a picture. The Space Needle is part of the larger Seattle Center complex.
Below, I'm standing in front of my poster, clad in a mid-late 1970s, Bill Veeck-inspired Chicago White Sox jersey. Baseball garb is a common form of attire at SABR meetings.
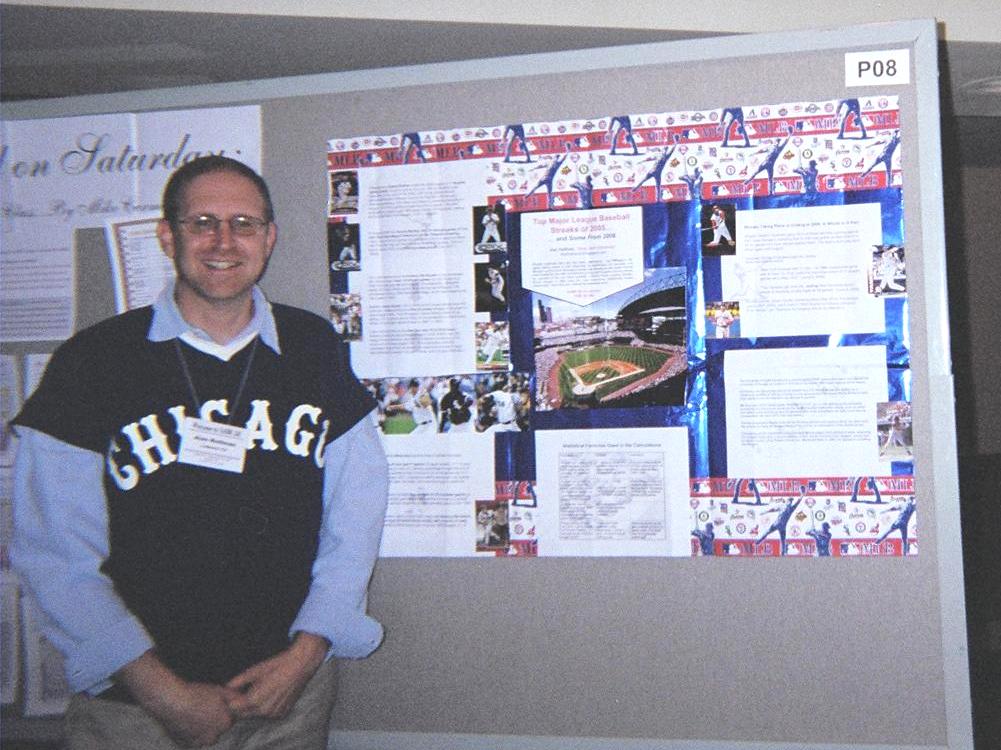
In my poster, I displayed brief synopses of several occurrrences from 2005 that stood out to me, either in terms of estimated statistical rarity or historical significance (i.e., time since previous similar occurrence). Here are the streaks...
Philadelphia’s Jimmy Rollins ended the 2005 season on a 36-game hitting streak, tying him (at the time) for 10th on the all-time list. According to the July 14-19, 2005 USA Today Sports Weekly (providing statistics through roughly the first half of the season), Rollins was batting .273, which converts to a baseline probability of roughly .710 of his getting at least one hit in a game (because a player usually gets multiple at bats in a game, the probability of his getting at least one hit is generally pretty high). This latter probability is raised to the 36th power (length of the streak), yielding as the probability of the streak, .710^36 = .000004.
In August 2005, the Florida Marlins went 25 straight games with no one other than Miguel Cabrera or Carlos Delgado homering (game-by-game log for second half of 2005 season). Using June and July games as a baseline (where at least one Marlin other than the “big two” had homered in 19 of 53 games, .358, or a failure rate of .642), the probability of the drought was .642^25 = .00002.
Poor performance from the Kansas City Royals is not unexpected. Still, when a team loses 19 straight games (as the Royals did in 2005 from late July well into August), it’s noteworthy (game-by-game log). Before the streak, KC had a 38-63 record, for a winning percentage of .376; conversely, this is a .624 losing percentage, which when raised to the 19th power = .0001. (Steve Levitt also looked at the Royals' losing streak last year.)
Seattle’s Ichiro Suzuki, who in 2004 set the single-season record for most hits, suffered through a 0-for-22 slump (longest of his career) in early August 2005. The mid-season Sports Weekly listed him as batting .311 (a failure rate of .689), so the probability of Ichiro’s going hitless in 22 straight official at-bats is .689^22 = .0003.
From mid-July 2005 on, the Red Sox won 19 of 20 at home (log). Boston’s home winning percentage prior to this stretch was .581. Using a binomial-statistic calculator, the team’s probability of winning 19 (or more) out of 20 was roughly .001. (This calculation probably overstates rarity of this hot stretch, as opponents included Tampa Bay, Minnesota, Kansas City, and Texas, plus Chicago White Sox.)
Finally, the 2005 White Sox recorded many impressive streaks:
They won 16 of their last 17 games (5 regular season, 11-1 in post-season). Based on their .611 winning percentage through the end of August, the probability of their winning 16 (or more) games out of 17 was approximately .005. (Cleveland made a late-season run rivaling that of the 1969 New York Mets, but it wasn’t enough to catch the Sox.)
Chicago pitchers recorded four straight ALCS complete games vs. the Angels, a similar post-season achievement not having occurred since Yankee pitchers threw five straight complete games in the 1956 World Series.
Chicago pitchers again worked their magic, not allowing the Astros a hit in their final 29 World Series at bats with runners on base, unprecedented in World Series play since the 1966 Dodgers (31 at bats).
I also mentioned some streaky developments from thus far in 2006 on my poster. Two of them I've already blogged about here (shown below), the University of South Carolina's five straight homers in NCAA play-off action against Georgia (June 12, 2006 entry) and Vladimir Guerrero's hitting against the Texas Rangers (June 5, 2006 entry).
Two additional 2006 streaks I noted on my SABR poster were the Yankees' streak of 10+ hit games and Boston catcher Jason Varitek's homering every May 20 for five straight years (2001-2005), a run that ended in 2006 (thanks to Indiana University professor Jim Sherman for bringing the latter streak to my attention).
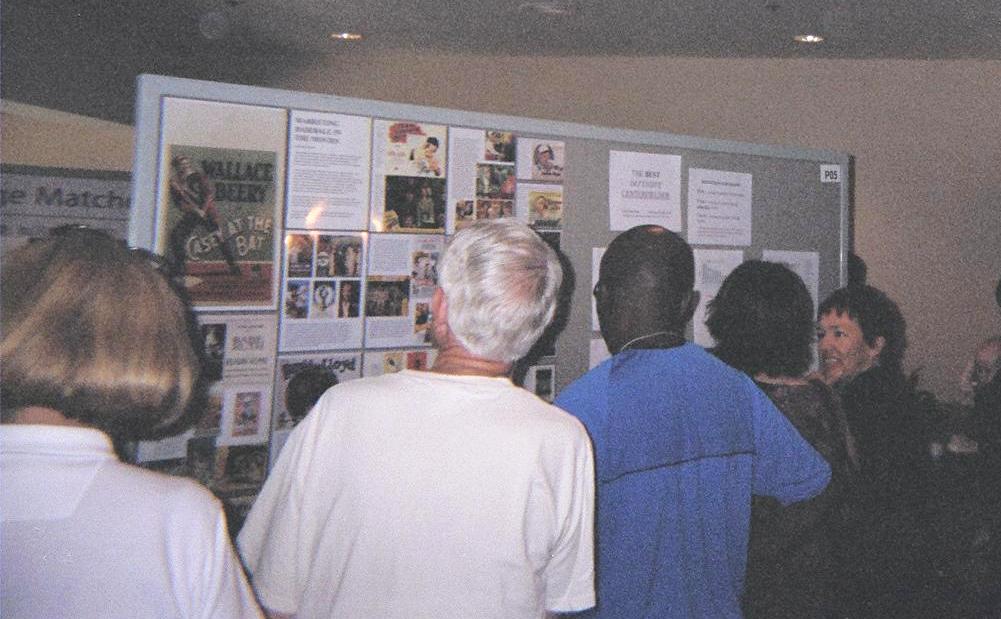
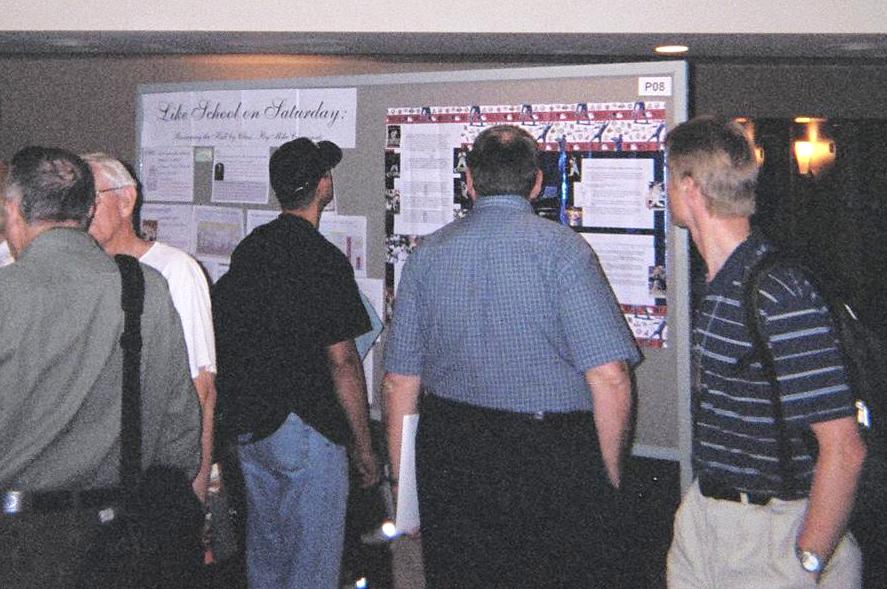
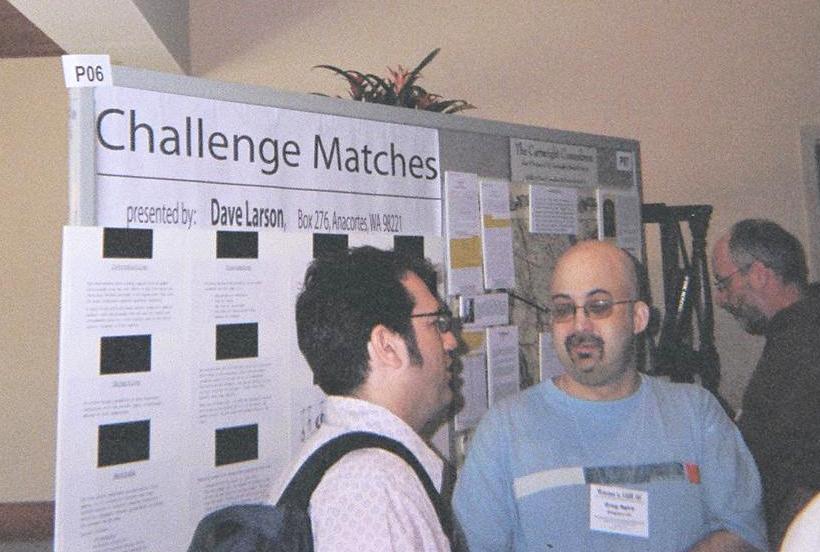
Below are some additional photos I took of the SABR poster session (here's the official list of posters, including summaries).


Wednesday, June 21, 2006
This year's NBA championship series is now over, with the Miami Heat defeating the Dallas Mavericks 4 games to 2. There were several instances of streakiness in the series, not least Miami's coming back from 2-0 down (and in great danger in Game 3) to take four straight. Each of the teams, as well as individual players, also went through periods of hotness and coldness, of course. Once the Heat began to turn the series around, Dwyane Wade went through stretches where it looked like he couldn't miss (and rarely did). At the other end of the spectrum, the Mavs' outside shooting during the second half of Game 6 seemed to disappear.
What I'd like to focus on here, though, is the dreadful free throw shooting of Miami center Shaquille O'Neal, whose statistics are available here. As all NBA fans know, even under the best of circumstances, Shaq is terrible from the stripe, making only 52.8% of free throws for his career (based on nearly 10,000 attempts!).
This past regular season, O'Neal slipped to 46.9% on free throws, then to 37.4% for the play-offs (68 of 182). In the finals against Dallas, Shaq's FT shooting was particularly hideous, 29.2% (14 of 48). In three of the games against the Mavs, he shot 1 of 9, 1 of 7, and 2 of 12.
Before possibly examining the depths of O'Neal's woes vs. Dallas, I think it's worth testing initially whether the roughly 10% drop in his FT percentage from the regular season to the play-offs overall is statistically significant. With a dichotomous outcome such as hit or miss on a free throw, a statistical technique known as the binomial probability (for which there's an online calculator in my links section, to the right) is very useful. It answers the question of how likely a given pattern is (i.e., a certain number of hits within some number of attempts), given some prior baseline percentage of success.
In Shaq's case, how likely is it that he would have made 68 (or fewer) free throws out of 182, assuming a baserate of .469 (corresponding to his FT percentage in the regular season)? Using the aformentioned calculator, this probability is .006, sufficiently small to be considered statistically significant (cut-offs of .05 or .01 are commonly used).
Thus, even when we take Shaq's play-off FT performance as a whole (not focusing merely on his horrible time in the final round), his fall-off from the regular season is more than would have been expected from ordinary fluctuation. Fatigue is a possibility, especially since his worst round in the play-offs was the last one. However, Shaq and the Heat had a six-day rest from the end of the Detroit series (June 2) to the start of the Dallas series (June 8), and he still went 1 for 9 from the line in the opener against the Mavs.
If anyone would like to conduct statistical analyses of other players in the Miami-Dallas series, please do so. You can provide a brief write-up of what you found in the comments section below.
What I'd like to focus on here, though, is the dreadful free throw shooting of Miami center Shaquille O'Neal, whose statistics are available here. As all NBA fans know, even under the best of circumstances, Shaq is terrible from the stripe, making only 52.8% of free throws for his career (based on nearly 10,000 attempts!).
This past regular season, O'Neal slipped to 46.9% on free throws, then to 37.4% for the play-offs (68 of 182). In the finals against Dallas, Shaq's FT shooting was particularly hideous, 29.2% (14 of 48). In three of the games against the Mavs, he shot 1 of 9, 1 of 7, and 2 of 12.
Before possibly examining the depths of O'Neal's woes vs. Dallas, I think it's worth testing initially whether the roughly 10% drop in his FT percentage from the regular season to the play-offs overall is statistically significant. With a dichotomous outcome such as hit or miss on a free throw, a statistical technique known as the binomial probability (for which there's an online calculator in my links section, to the right) is very useful. It answers the question of how likely a given pattern is (i.e., a certain number of hits within some number of attempts), given some prior baseline percentage of success.
In Shaq's case, how likely is it that he would have made 68 (or fewer) free throws out of 182, assuming a baserate of .469 (corresponding to his FT percentage in the regular season)? Using the aformentioned calculator, this probability is .006, sufficiently small to be considered statistically significant (cut-offs of .05 or .01 are commonly used).
Thus, even when we take Shaq's play-off FT performance as a whole (not focusing merely on his horrible time in the final round), his fall-off from the regular season is more than would have been expected from ordinary fluctuation. Fatigue is a possibility, especially since his worst round in the play-offs was the last one. However, Shaq and the Heat had a six-day rest from the end of the Detroit series (June 2) to the start of the Dallas series (June 8), and he still went 1 for 9 from the line in the opener against the Mavs.
If anyone would like to conduct statistical analyses of other players in the Miami-Dallas series, please do so. You can provide a brief write-up of what you found in the comments section below.
Monday, June 12, 2006
Leading up to this past weekend, I had been planning to write something about how the men's French Open tennis final would be pitting two players against each other, who each had phenomenal streaks coming in. That indeed happened and I will still write about it, but something else happened over the weekend in college baseball, which I think tops the tennis match.
The University of South Carolina hit a mind-boggling five consecutive home runs against the University of Georgia, en route to a 15-6 win and 1-0 lead in the teams' two-out-of-three super-regional series (final qualifying round before the College World Series).
A simple way to estimate the probability of five homers in five at bats is to start with the Gamecocks' baseline probability of hitting a home run in any single at bat. This Southeastern Conference (SEC) baseball statistics page (updated through June 6, as I'm looking at it) tells us that, out of 2,215 at bats this season, South Carolina had hit 82 homers (.037).
Alternatively, we could increase the denominator by adding in plate appearances that are not counted as official at bats. The main source of such extra appearance are walks, however, and one could argue that many walks represent instances where the pitcher does not want to give the hitter the opportunity to swing the bat (explicitly, when there's an intentional walk, but also when a team "pitches around" a hitter). Also, by using only official at bats as the denominator (and thus keeping the home run ratio a little higher), that will make my upcoming calculation a little more conservative (i.e., helping to avoid overstating the rarity of the occurrence).
We then simply raise the Gamecocks' probability of a home run on a single at bat (.037) to the fifth power (representing the five homers), which yields .00000007 (7 X 10 to the minus eighth power, or 7 in 100 million). This type of calculation is analogous to determining that the probability of rolling double sixes on two dice is 1/36, by raising the probability of a six on a single die (1/6) to the second power.
In the dice example, it is assumed that the outcomes of the roll of two dice are independent (i.e., the number that comes up on one die does not affect the number that comes up on the other). One may question whether the independence assumption holds up in this home run-hitting scenario. Many of you are probably thinking that the same Georgia pitcher was throwing to these batters and just kept "grooving" the ball to the hitters, based on loss of speed and/or movement on the pitches. That may be true to some extent, but it must be noted that after the first three homers of the streak, Georgia changed pitchers and the new guy gave up two more homers!
Another consideration is that I was drawn to analyze the South Carolina streak by its spectacular nature. If we were to ask instead, in all the countless college baseball games played over a period of years, how likely is it that we would find such a streak at some point, the streak would not seem so unlikely.
Here is a passage from the textbook I use in teaching statistics (King & Minium, 2003, Statistical Reasoning in Psychology and Education, p. 205):
Let us consider again the case of Evelyn Adams... who won the New Jersey Lottery twice in a 4-month time span in 1986. The probability of Ms. Adams doing this was 1 in 17 trillion... If there were 4,123,000 lottery tickets sold for each lottery, and Ms. Adams had purchased 1 ticket for each, the probability of her winning both was (1 / 4,123,000) (1 / 4,123,000), the same as for any other specific person who purchased 1 ticket in each lottery.
But the probability of someone, somewhere winning two lotteries in 4 months is a different matter altogether. Professors Diaconis and Mosteller (1989) calculated the chance of this happening to be only 1 in 30.
The citation for the original Diaconis and Mosteller article is:
Diaconis, P., & Mosteller., F. (1989). Methods for studying coincidences. Journal of the American Statistical Association, 84, 853-861.
In fact, as the above-linked article about the South Carolina homer barrage notes, the five "dingers" merely tied the NCAA record (set in 1998), rather than breaking it.
What about the tennis match that I started this write-up with? I've gone on too long for a detailed statistical analysis, so I'll just note that Rafael Nadal came into the French Open final having won 59 straight matches on clay (the surface in the French), whereas his opponent Roger Federer had won 27 consecutive matches in major (Grand Slam) tournaments, capturing Wimbledon, the U.S. Open, and the Australian Open, before advancing to the finals in Paris (none of these three tournaments won by Federer are played on clay). Nadal beat Federer, and I'll leave you to read about it here.
The University of South Carolina hit a mind-boggling five consecutive home runs against the University of Georgia, en route to a 15-6 win and 1-0 lead in the teams' two-out-of-three super-regional series (final qualifying round before the College World Series).
A simple way to estimate the probability of five homers in five at bats is to start with the Gamecocks' baseline probability of hitting a home run in any single at bat. This Southeastern Conference (SEC) baseball statistics page (updated through June 6, as I'm looking at it) tells us that, out of 2,215 at bats this season, South Carolina had hit 82 homers (.037).
Alternatively, we could increase the denominator by adding in plate appearances that are not counted as official at bats. The main source of such extra appearance are walks, however, and one could argue that many walks represent instances where the pitcher does not want to give the hitter the opportunity to swing the bat (explicitly, when there's an intentional walk, but also when a team "pitches around" a hitter). Also, by using only official at bats as the denominator (and thus keeping the home run ratio a little higher), that will make my upcoming calculation a little more conservative (i.e., helping to avoid overstating the rarity of the occurrence).
We then simply raise the Gamecocks' probability of a home run on a single at bat (.037) to the fifth power (representing the five homers), which yields .00000007 (7 X 10 to the minus eighth power, or 7 in 100 million). This type of calculation is analogous to determining that the probability of rolling double sixes on two dice is 1/36, by raising the probability of a six on a single die (1/6) to the second power.
In the dice example, it is assumed that the outcomes of the roll of two dice are independent (i.e., the number that comes up on one die does not affect the number that comes up on the other). One may question whether the independence assumption holds up in this home run-hitting scenario. Many of you are probably thinking that the same Georgia pitcher was throwing to these batters and just kept "grooving" the ball to the hitters, based on loss of speed and/or movement on the pitches. That may be true to some extent, but it must be noted that after the first three homers of the streak, Georgia changed pitchers and the new guy gave up two more homers!
Another consideration is that I was drawn to analyze the South Carolina streak by its spectacular nature. If we were to ask instead, in all the countless college baseball games played over a period of years, how likely is it that we would find such a streak at some point, the streak would not seem so unlikely.
Here is a passage from the textbook I use in teaching statistics (King & Minium, 2003, Statistical Reasoning in Psychology and Education, p. 205):
Let us consider again the case of Evelyn Adams... who won the New Jersey Lottery twice in a 4-month time span in 1986. The probability of Ms. Adams doing this was 1 in 17 trillion... If there were 4,123,000 lottery tickets sold for each lottery, and Ms. Adams had purchased 1 ticket for each, the probability of her winning both was (1 / 4,123,000) (1 / 4,123,000), the same as for any other specific person who purchased 1 ticket in each lottery.
But the probability of someone, somewhere winning two lotteries in 4 months is a different matter altogether. Professors Diaconis and Mosteller (1989) calculated the chance of this happening to be only 1 in 30.
The citation for the original Diaconis and Mosteller article is:
Diaconis, P., & Mosteller., F. (1989). Methods for studying coincidences. Journal of the American Statistical Association, 84, 853-861.
In fact, as the above-linked article about the South Carolina homer barrage notes, the five "dingers" merely tied the NCAA record (set in 1998), rather than breaking it.
What about the tennis match that I started this write-up with? I've gone on too long for a detailed statistical analysis, so I'll just note that Rafael Nadal came into the French Open final having won 59 straight matches on clay (the surface in the French), whereas his opponent Roger Federer had won 27 consecutive matches in major (Grand Slam) tournaments, capturing Wimbledon, the U.S. Open, and the Australian Open, before advancing to the finals in Paris (none of these three tournaments won by Federer are played on clay). Nadal beat Federer, and I'll leave you to read about it here.
Monday, June 05, 2006
Welcome to the relaunching of the Hot Hand in Sports website. After somewhat over four years with the old look, I thought something new was in order. This new format should also provide several advantages over the old one:
*The URL is now much simpler (be sure to notice, however, that it's thehothand.blogspot.com; "hothand" without the "the" will lead to another, unrelated site).
*Readers can now comment on my entries (I've put in some steps, however, in an attempt to prevent spam).
*Over the years, my write-ups have been shifting away from long, detailed analytic pieces to brief summaries, always with a link to an article about the sports performance in question, and sometimes with statistical analyses of my own. The format on this new hosting site should fit well with my trend toward succinctness.
Another nice thing is that Blogspot has now made it much easier than before to post visual images. Though perhaps not as frequently as before, I still occasionally may want to post charts, graphs, and the like.
In the coming days and weeks, I will be inserting links on this new page, attempting to preserve as much of the information on the old page as possible. If there's something on the old page that you don't see here, please don't hesitate to inquire by e-mail (via the link to my faculty webpage in the upper-right portion of the page).
***
One recent, substantive hot streak that I wanted to mention is that the Angels' Vladimir Guerrero got a hit in all three late-May games against the Texas Rangers, meaning that he has now gotten at least one hit in all 42 games he's ever played against them. To quote the headline I came up with and was using on my old site, "Texas Can't Be Glad to See Vlad." The teams now don't play each other again until August.
*The URL is now much simpler (be sure to notice, however, that it's thehothand.blogspot.com; "hothand" without the "the" will lead to another, unrelated site).
*Readers can now comment on my entries (I've put in some steps, however, in an attempt to prevent spam).
*Over the years, my write-ups have been shifting away from long, detailed analytic pieces to brief summaries, always with a link to an article about the sports performance in question, and sometimes with statistical analyses of my own. The format on this new hosting site should fit well with my trend toward succinctness.
Another nice thing is that Blogspot has now made it much easier than before to post visual images. Though perhaps not as frequently as before, I still occasionally may want to post charts, graphs, and the like.
In the coming days and weeks, I will be inserting links on this new page, attempting to preserve as much of the information on the old page as possible. If there's something on the old page that you don't see here, please don't hesitate to inquire by e-mail (via the link to my faculty webpage in the upper-right portion of the page).
***
One recent, substantive hot streak that I wanted to mention is that the Angels' Vladimir Guerrero got a hit in all three late-May games against the Texas Rangers, meaning that he has now gotten at least one hit in all 42 games he's ever played against them. To quote the headline I came up with and was using on my old site, "Texas Can't Be Glad to See Vlad." The teams now don't play each other again until August.
Subscribe to:
Posts (Atom)