Thursday, June 28, 2012

Dodgers' Offense Cools Off

The L.A. Dodgers, who started out the season with a 30-13 record (.698), averaging 4.58 runs per game during these 43 contests, have hit the skids.

With yesterday's series-concluding 3-0 loss to San Francisco by Los Angeles -- coming on the heels of 2-0 and 8-0 Dodger losses to the Giants -- the two teams are now tied for first place in the National League West. The Dodgers had led their northern California rival by eight games earlier this season. The Bay Area, on the whole, has not been kind to the Dodgers lately, as they were swept by the A's in Oakland June 19-21 by scores of 3-0, 4-1, and 4-1.

Going back to the Dodger-Giant series, however, the L.A. Times article on yesterday's game noted the following:

... the Dodgers have been held scoreless the last 30 consecutive innings. It was the first time the Los Angeles Dodgers had been shut out by one team in three consecutive regular-season games. The Brooklyn Dodgers suffered the same fate in 1937.

The Dodgers moved west in 1958, so the specific type of scoreless streak alluded to in the quote is unprecedented for 54 years. Note the important qualifier in the quote, however:

... the first time the Los Angeles Dodgers had been shut out by one team in three consecutive regular-season games... 

This qualifier suggested to me that the Los Angeles-era Dodgers must have been blanked three straight at some point before this week, but involving more than one opponent (i.e., being shut out once or twice by one team to close out a series and then being shut out once or twice in a series against a new opponent). I thus perused Dodger game logs going back in time and found the following sequence in 2007:

Sun, Aug 5 vs Arizona L 3-0
Tue, Aug 7 @ Cincinnati L 4-0
Wed, Aug 8 @ Cincinnati L 1-0

There could well be additional three-game Dodger scoreless streaks against multiple opponents prior to 2007, of course. But even though a Dodger three-game runless streak may not be quite as rare as it originally seemed, there's no question the L.A. bats are quiet.

The most obvious reason would have to be the absence of Matt Kemp, who has played in only two games since May 13 due to hamstring problems. He had been going wild offensively before his injury. For those who prefer traditional baseball statistics, Kemp hit 12 home runs and recorded a .355 batting average before his extended absence; for those into sabermetrics, Kemp had compiled a stratospheric 1.163 OPS (On-base [.444] Plus Slugging [.719] percentages).

The absence of one player alone, presumably, would not be enough to quell the entire offense of a team that had been doing so well. I thus examined the monthly offensive output (again using OPS) for the five Dodgers with the most at-bats so far this season (which would not include Kemp). From ESPN.com's Dodger statistics page, you can click on a player's name and then click on "Splits" to see the monthly breakdowns. The following graph presents what I found.


Two players in particular, right-fielder Andre Ethier (who himself was injured in yesterday's series finale against the Giants) and catcher A.J. Ellis, were hitting at exceptionally torrid paces in April and (especially) May. An OPS around 1.000, which Ethier and Ellis reached in May, is very rare. Currently only four National Leaguers are above 1.000 for the season. As shown in the graph, Ethier and Ellis have now come down to the .600s thus far in June, well below each player's respective career OPS (Ethier, .843; Ellis, .766).Other Dodger players in the graph have either remained level or dipped slightly in their OPS from May to June.

Thursday, June 21, 2012

How Much of an Advantage is Hosting Middle Three Games in NBA Finals 2-3-2 Format?

Since 1985, the NBA has used a 2-3-2 format for the final series. In other words, for a theoretical seven-game series, the team with the better regular-season record hosts the first two games, then the next three games are played in the other team's arena, with the final two games returning to the home of the team with the better regular-season record.

A question that sometimes comes up is whether having three games in a row at home (as opposed to a 2-2-1-1-1 format) gives the team with the poorer regular-season ledger a special momentum-based advantage. This question is again relevant, in light of how this year's final series has gone. The Miami Heat, after splitting the first two games of this year's finals in Oklahoma City, has, of course, won Games 3 and 4 at home and will be going for the championship tonight while again playing in Miami.

Based on this list of NBA championship match-ups (with further details available by clicking on the year in the chart in the linked document), I counted eight years (prior to the current season) in which a team had won Games 3 and 4, giving it the opportunity to "ride the wave" to win also in Game 5. In three of these eight final series, it was actually the road team that caught fire in Games 3-5. The 1990 Detroit Pistons, 1991 Chicago Bulls, and 2001 L.A. Lakers all split the first two games of their respective series at home, then won three straight on the road to win titles.

More relevant for tonight's Thunder-Heat tilt are the five cases from 1985-2011 in which the home team won Games 3 and 4 at home. They are listed in the following table.

Year Home Team Games 3-5 Chance to Close Out Series in Game 5? Home-Team Result in Game 5
1997 Utah No Lose
1998 Chicago Yes Lose
2004 Detroit Yes Win
2005 Detroit No Lose
2006 Miami No Win

Given the small sample size, these findings should be interpreted very cautiously. For what it's worth, however, three of the five teams that won Games 3 and 4 at home went on to lose in Game 5. The two series that best resemble this year's in terms of the win-loss patterns for the home and away teams are those from 1998 and 2004 (highlighted above in red). These two series offer a mixed verdict for 3-4-5 momentum.

In 1998, Michael Jordan's Chicago Bulls split the first two games of the finals in Utah, then returned to the Windy City to win Games 3 and 4. With a chance to close out the series at home in Game 5 (akin to the Heat tonight), the Bulls faltered. They ultimately did win the series, though, back in Utah with a Game-6 victory over the Jazz.

In 2004, the Detroit Pistons split the first two games against the Lakers in L.A., then won Games 3 and 4 in Michigan to take a 3-1 lead. There was no stopping the host Pistons in Game 5, as they dispatched the Lakers 100-87 to win the championship.

Again, there are not many data points on the specific situation facing Miami and OKC tonight. However, the little historical evidence we have suggests that the Heat is not an absolute shoo-in for coronation in Game 5.

Wednesday, June 20, 2012

Dominant Pitching by Mets' R.A. Dickey

ESPN.com has a couple of interesting articles on the hot streak currently being enjoyed by New York Mets pitcher R.A. Dickey. Monday night, the 37-year-old knuckleballer threw his second consecutive one-hitter, but his pitching dominance goes back further than these last two starts.

One article, entitled "R.A. Dickey on One of Great Rolls of All Time," lays out the basic facts: "Over his past six starts, Dickey is 6-0 with a 0.18 ERA (one earned run in 48 2/3 innings), 63 strikeouts, five walks and a .131 average allowed." The author of this article, David Schoenfield, then offers his opinions on what are some of the other great streaks of pitching mastery. Here's his list, with some illustrative quotes:
  • Orel Hershiser: "spun six consecutive shutouts in September 1988."
  • Greg Maddux: "In 1994... posted a 1.56 ERA; he was mostly a model of consistency that season, allowing two earned runs or fewer in 21 of his 25 starts."
  • Pedro Martinez: "Over his final seven starts [in 1999], he allowed seven runs (five earned) with eight walks and 96 strikeouts in 55 innings. In consecutive starts, he struck out 15, 11, 15, 17, 14, 12 and 12."
  • Fernando Valenzuela: "at the start of the 1981 season ...he threw five shutouts in seven starts and allowed two runs in 63 innings."  (Note: I analyzed the "Fernandomania" streak here.)
  • Bob Gibson: "in 1968, had an 11-start stretch in which he threw 11 complete games and allowed three runs." 

In my book Hot Hand, which came out before the 2012 season, I discussed all-time streaks of pitching greatness (pp. 91-93). I also mentioned Gibson. Another pitcher I discussed is Don Drysdale, who for whatever reason was omitted from Schoenfield's article. In 1968, a great year for pitchers due in part to their getting to stand on a 15-inch-high pitchers' mound (lowered the next season to 10 inches), Drysdale pitched 58 2/3 consecutive scoreless innings. This record held until Hershiser topped it 20 years later.

For a short-term, high-intensity streak, there's the record set in 2009 by then-White Sox pitcher Mark Buehrle of retiring 45 consecutive batters, with the stretch encompassing a perfect game.

The other ESPN.com article I alluded to asks in its headline, "Will Dickey's Dominance Continue?" Before addressing that question, the writer, Tristan Cockcroft, adds another name to the list of great pitching reigns: "Johan Santana's 13-0, 1.21 ERA and 11.13 K's-per-nine ratio during the second half of 2004..."

What I see as the main contribution of Cockcroft's article is his division of Dickey's statistics -- apparently based on extensive watching of Dickey's performances on video -- into those when he throws his knuckleball 78 mph or faster vs. 77 mph or slower. The differences are pretty dramatic, such as a .111 opponents' batting average (or batting average against, BAA) on the faster knucklers, compared to .283 on the slower ones.

Cockcroft notes that extensive pitching-velocity data are a relatively new development, thus limiting historical comparisons. For what it's worth, Tim Wakefield (who pitched from 1992-2011) "never topped 74.7 mph since 2009."

The message from Cockcroft's article seems to be that, if Dickey can continue to throw his "fast knucklers," he can indeed maintain his streak of dominance. However, due to ordinary uncertainty and the relative lack of historical precedents for knuckleball pitchers, we really don't know what will happen. Cockcroft chooses to be optimistic, asking "who is to say [Dickey] can't continue at or near the pace he's currently on?"

Tuesday, June 19, 2012

Heat on Free-Throw Hot Stretch

Whereas Miami forward Shane Battier has exhibited some hot three-point shooting this postseason (which he extended by going 2-of-2 behind the arc in Game 3 of the finals), the team as a whole has stepped up its free-throw success rate. The following chart shows the Heat's free-throw shooting percentages -- and those of its offensive stalwart LeBron James -- in each of Miami's 2012 postseason games (you may click on the graphic to enlarge it).
  

In the two most recent final-round games against the Thunder (labeled as OKC 2 and OKC 3 on the horizontal axis), Miami has registered free-throw shooting percentages of .880 (22-of-25) and .886 (31-of-35). Not since its series-clinching Game-6 win over Indiana in the second round had the Heat hit from the stripe at a .800 clip (indicated by the white line in the graph). In none of the seven games of the Eastern Conference finals vs. Boston did Miami make 80% of its free throws, nor did it happen in Game 1 against Oklahoma City. The Heat did accomplish the feat twice in the first round against New York (Game 3 and Game 5).

James has been a major part of Miami's free-throw renaissance, going a perfect 12-for-12 in Game 2 vs. OKC, in addition to nights of 7-of-9 in Game 1 and 6-of-8 in Game 3. Overall for the championship round, James is 25-for-29 (.862). Perhaps the combination of the importance of the finals and the tightness of the games has prompted James to concentrate better on free throws. In three of the Heat's earlier playoff games, he made fewer than half of his shots from the stripe (3-of-7 in Game 2 against the Knicks; 1-of-3 in Game 3 vs. the Pacers; and 1-of-5 in the third game of the Boston series).

During the regular season, Miami's team free-throw percentage was .775. For the playoffs as a whole thus far (21 games), it's even worse, .741. Can the Heat sustain its recent 88% free-throw success in the remaining games of the finals?

Saturday, June 16, 2012

Battier Steps Up His Three-Point Shooting Percentage

I would say the dominant story of this year's NBA finals, two games in, is the drama of Miami's LeBron James and Oklahoma City's Kevin Durant trying to will their respective teams to victory. Not far behind, however, is the way Heat forward Shane Battier, the 11-year veteran from Duke, has lifted his three-point shooting accuracy. Typically thought of as a defensive specialist, Battier wasn't exactly scorching from behind the arc in the regular season, registering a .339 percentage (62-for-183). His game-by-game statistics are available here.

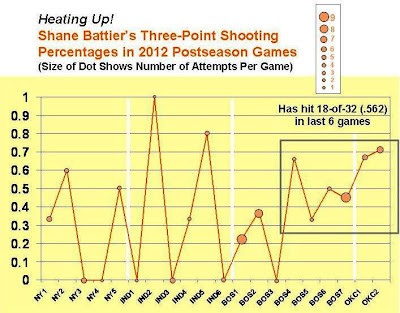
His overall postseason shooting percentage on threes at this point is .371 (36-of-97), up slightly from the regular season. However, in the latter part of the Eastern Conference finals against Boston and now thus far against Oklahoma City, Battier is on a run that has him making more than half of his three-point attempts. The following graph shows his game-by-game three-point shooting in the playoffs, with his recent hot streak highlighted in a box on the right-hand side.


As depicted in the graph, Battier had a lot of ups and downs in his three-point shooting in the first round vs. the New York Knicks and the second round vs. the Indiana Pacers; however, in many of these games, he had few attempts. Now he's getting a lot more attempts, including 9 in the seventh game against the Celtics (of which he made 4), 6 in the opener against the Thunder (of which he made 4), and 7 in Game 2 against OKC (of which he made 5).

There will be at least three more games in the final series. Whether the factors that have allowed Battier to shoot so well thus far, such as Oklahoma City's defensive scheme and a little old-fashioned luck (as on this shot that he banked in), continue in his favor, remains to be seen.